


Figure 8.
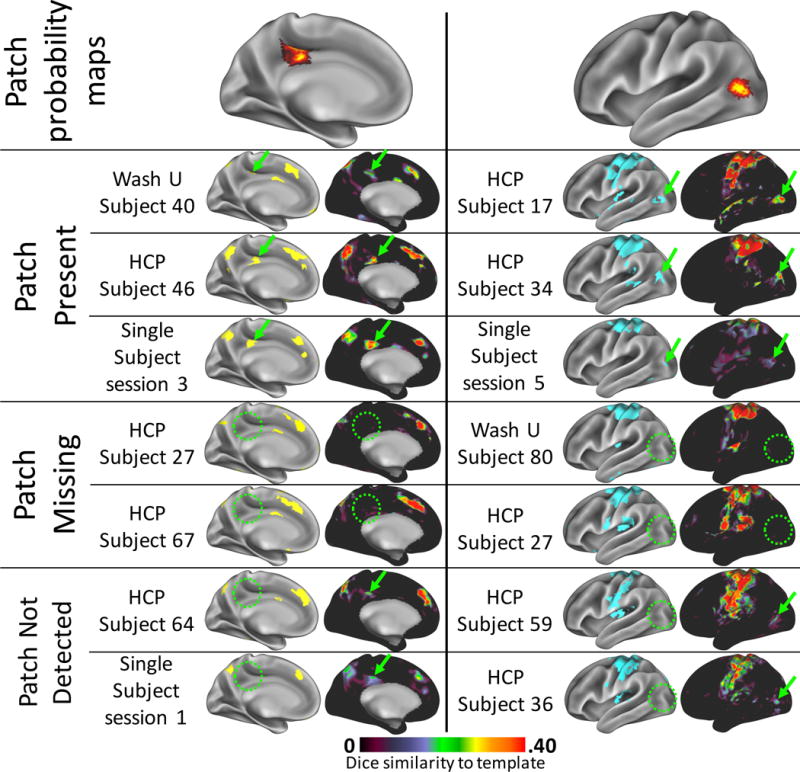
“Missing” patches appeared to be truly absent in some subjects, but failed to be identified in others. Top row: two example patches, one from the Fronto-parietal system (left) and one from the Dorsal Motor system (right), which were detected in ~50% of subjects. Rows 2–4: example high-data subjects and Single Subject dataset sessions in whom the patch was detected (green arrows). On the left are all patches in the brain system derived from the individual’s/session’s data. On the right are the Dice similarity maps to the template brain system, indicating how well each cortical vertex’s connectivity pattern matches the template system’s connectivity pattern. Regions of high Dice similarity can be clearly matched to the identified brain system patches. Rows 5–6: example high-data subjects in whom the patch was not detected (green circles). The Dice maps confirm that no vertices in that area were at all similar to the template systems, suggesting a truly missing system patch. No sessions from the Single Subject dataset could be found that were truly missing patches present in other sessions. Rows 7–8: Example high-data subjects and Single Subject sessions in whom the patch was not detected but may exist below the threshold for detection. Small, relatively weak regions of Dice similarity (green arrows) were present that could represent the patch, but were not identified as such (green circles).