


Figure 2. Continuous sedimentation coefficient distributions of PAD4 WT and the hydrophobic substrate-binding-site mutants.
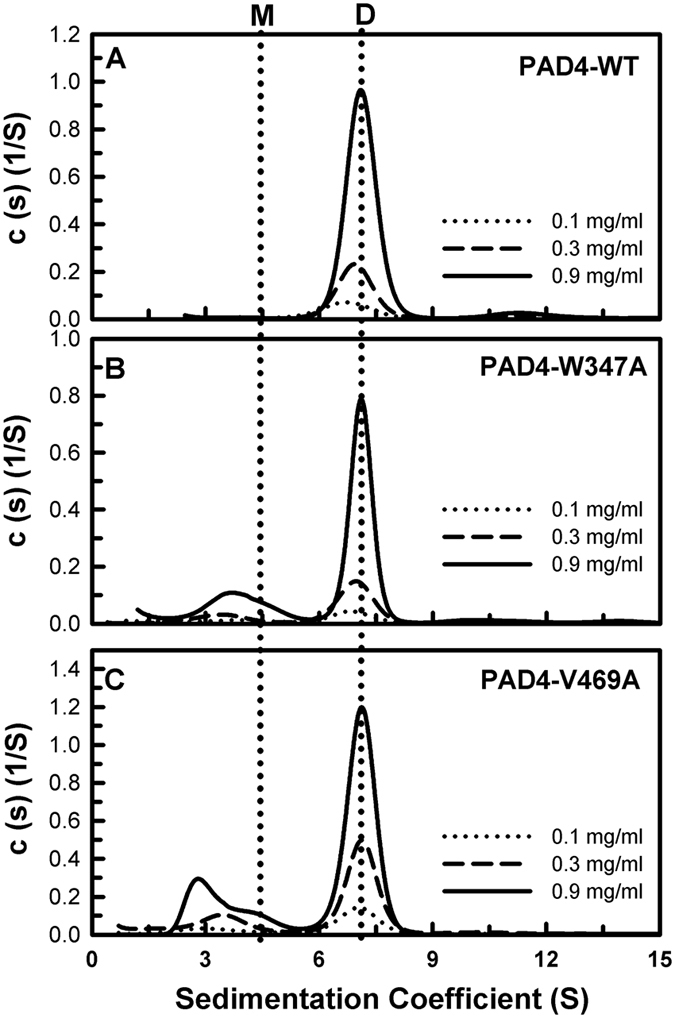
(A) WT. (B) W347A. (C) V469A. Three protein concentrations (0.1, 0.3, and 0.9 mg/ml) were analyzed as indicated in the figure. The sedimentation velocity data were globally fit using the SEDPHAT program to obtain the Kd (dissociation constant) of the PAD4 dimer (Table 1). M, monomer; D, dimer.