


FIG 1.
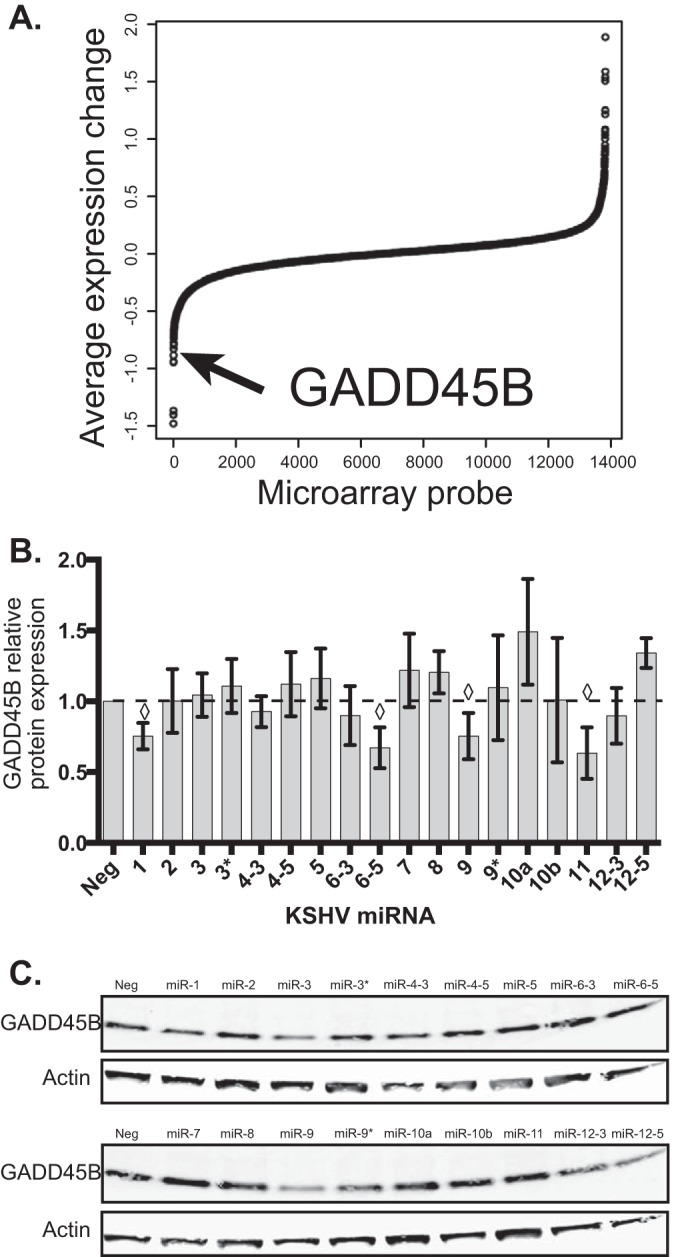
GADD45B expression is repressed by KSHV infection and specific KSHV miRNAs. (A) Microarray data were analyzed for changes after KSHV infection (48 h) or transfection of KSHV miRNAs (30 h). Average expression changes are shown from the two conditions and sorted by expression change. The arrow shows the location of the probe corresponding to GADD45B. (B) Primary endothelial cells were transfected with individual miRNA mimics and harvested 48 h after transfection. Protein expression changes of GADD45B (normalized to the loading control beta-actin) were obtained by immunoblotting using fluorescently labeled secondary antibodies and normalized to a nontargeting negative-control miRNA (miR-Neg). ♢, P value of <0.05 compared to miR-Neg using the Student t test. (C) A representative Western blot is shown for GADD45B (18 kDa) and beta-actin (45 kDa). The loading control was beta-actin.