


Figure 6.
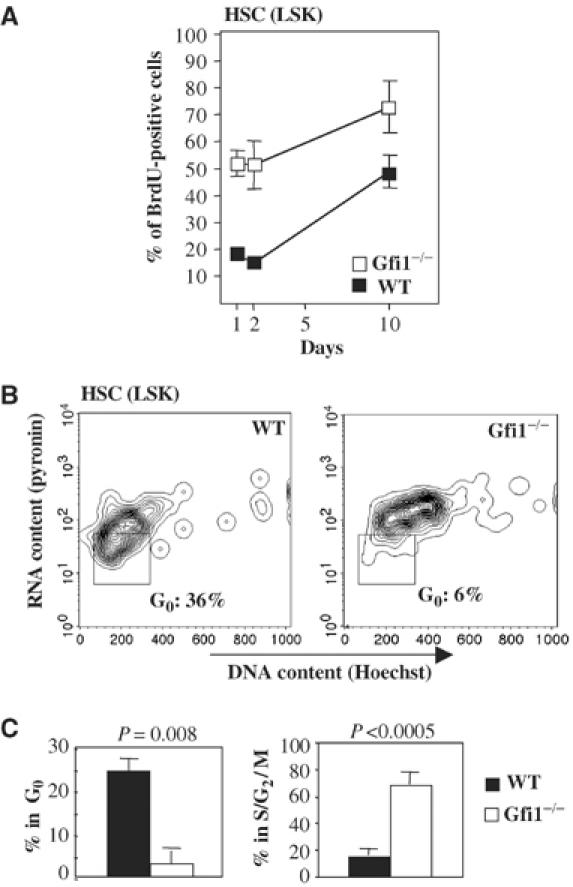
Cell cycle phase distribution of HSCs between G0/G1 and S/G2/M phases is altered in Gfi1−/− mice. (A) LSK cells were labeled with BrdU over the indicated time period. Gfi1−/− LSK cells show a significantly higher incorporation of BrdU than LSK cells from WT mice. (B) Bone marrow cells were stained to identify LSK cells and with a combination of Hoechst (DNA) and pyroninY (RNA). LSK cells were analyzed for incorporation of DNA and RNA dyes to assess the proportions of HSCs in the G0 and the S/G2/M phases of the cell cycle. The absence of Gfi1 correlated with a drastic loss of HSCs (LSK cells) in G0 phase. (C) Percentages of WT and Gfi1−/− HSCs (LSK cells) in different cell cycle phases. Given are average values with standard deviations from four WT and four Gfi1−/− animals.