


Figure 2. Identification of differentially expressed lncRNAs in bladder carcinoma tissues.
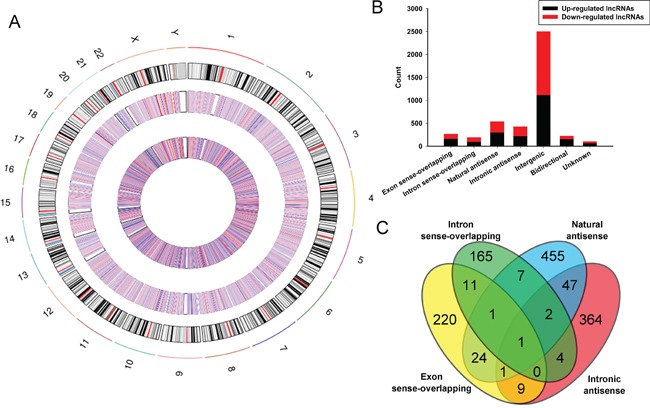
A. Circos plot showing lncRNAs on human chromosomes. The outermost layer of circos plot is chromosome map of the human genome, black and white bars are chromosome cytobands, red bars represent centromeres. The increased or decreased lncRNAs have been marked in red or blue bars, respectively. The larger inner circle represents all target lncRNAs dectected by microarray probes, and the smaller inner circle indicates the significantly differentially changed lncRNAs with fold change≥2.0, P < 0.05 and FDR < 0.05. B. Types and counts of differentially regulated lncRNAs detected by microarray (fold change ≥2.0, P < 0.05 and FDR < 0.05). The lncRNAs are classified into 6 types according to the relationship and genomic loci with their associated coding genes. One lncRNA may be associated with several mRNAs for disparate relationships. C. The Venn diagram presents the overlapping of relationships and the numbers indicate the lncRNA counts. While, the amounts of each lncRNA types are totalized in the bar chart showing the up and down regulated lncRNAs respectively.