


Figure 4. Mutations throughout the eIF3 complex compromise its ability to accelerate recruitment of capped native RPL41A mRNA to the PIC.
(A) mRNA recruitment reactions were quenched at appropriate time points on a running native gel to separate free [32P]-capped RPL41A mRNA from mRNA recruited to form 48S PICs. The bands were quantified to determine the fraction of total mRNA bound at each time point. (B) Individual time courses were fit with single-exponential rate equations to determine the observed rate constant for each experiment. (C) The observed rates of mRNA recruitment of capped RPL41A mRNA measured in the presence of WT (blue bar) and variants of eIF3 (red bars). Bars and errors represent mean values and SEM, respectively (as determined by individual fitting of each experiment), of ≥2 experiments.
DOI: http://dx.doi.org/10.7554/eLife.20934.011
Figure 4—source data 1. Individual observed apparent rates for RPL41A mRNA recruitment.
elife-20934-fig4-data1.xlsx (9KB, xlsx)
DOI: 10.7554/eLife.20934.012

Figure 4—figure supplement 1. The recruitment of unstructured model mRNAs to the PIC depends on the presence of an AUG codon and 40S subunits.

(A) Representative mRNA recruitment gel showing recruitment time course for the noAUG unstructured model mRNA, which lacks a start codon. (B) Comparison of mRNA recruitment gels at 120’, both in the presence and absence of eIF3, for the 5’5-AUG, 3’5-AUG, and midAUG mRNAs, all of which contain an AUG codon, and the noAUG mRNA, which lacks a start codon. (C) mRNA recruitment gels for the 5’5-AUG (left panel) and 3’5-AUG mRNAs (right panel), showing lanes containing reactions lacking either 40S subunits (- 40S, left lane) or eIF3 (- eIF3, middle lane), or in the presence of both (+, right lane).
Figure 4—figure supplement 2. Comparison of the kinetics of mRNA recruitment for WT and variant eIF3 at 26°C and 37°C.
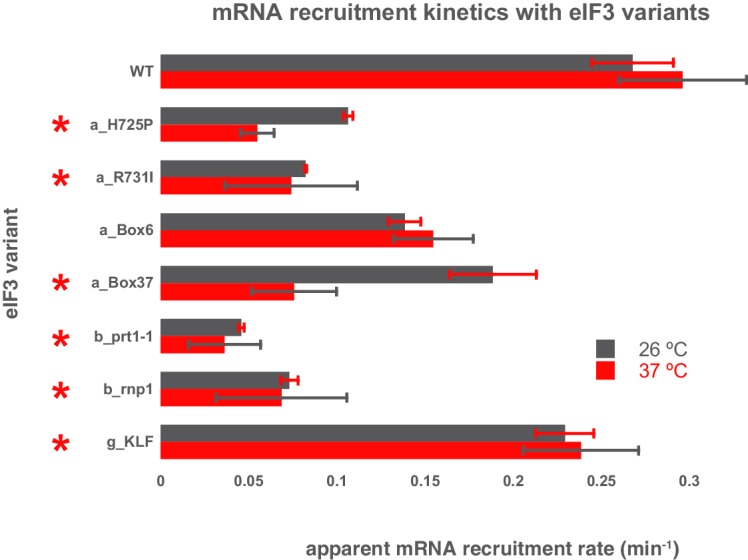
The apparent rates of mRNA recruitment of capped RPL41A mRNA observed in the presence of WT and eIF3 variants that confer Ts- phenotypes in vivo (denoted with asterisks) as well as the box6 variant, which does not. Bars represent apparent recruitment rates at either 26°C (grey bars) or 37°C (red bars). Bars and errors represent mean values and SEM, respectively (as determined by individual fitting of each experiment), of ≥2 experiments.