


Figure 3.
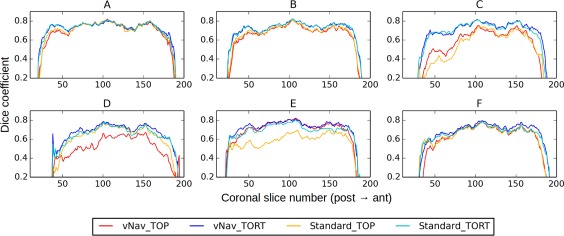
Dice coefficients of overlap between WM masks defined using FA and T1w images (same subjects as Figs. 1 and 2). Individual Dice coefficients were calculated for each coronal slice in the overlaid volumes. Dice values are relatively constant across the volumes, with vNav_TORT consistently showing the highest values. [Color figure can be viewed at http://wileyonlinelibrary.com]