


Figure 2. Effect of pH on the enzymatic activity of endolysin λSa2lys and Art-240.
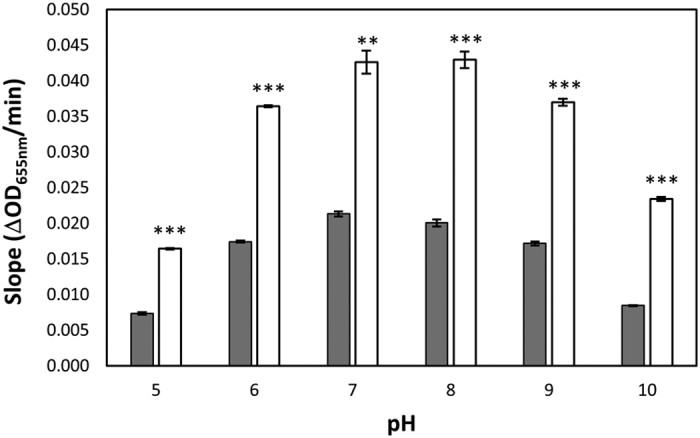
The enzymatic activities were determined using a turbidity reduction assay with equimolar amounts (0.1 μM) of λSa2lys (grey) and Art-240 (white), and reported as the slopes derived from 60-min curves from S. agalactiae LiCC S461 in the exponential phase performed under various pH conditions. Data are means ± standard deviations of three replicates. Student t-test was performed to compare the activity of λSa2lys and Art-240 within each pH value. **P < 0.01: ***P < 0.001.