


Figure 6. Linc00673 could directly bind LSD1 and silence NCLAD transcription.
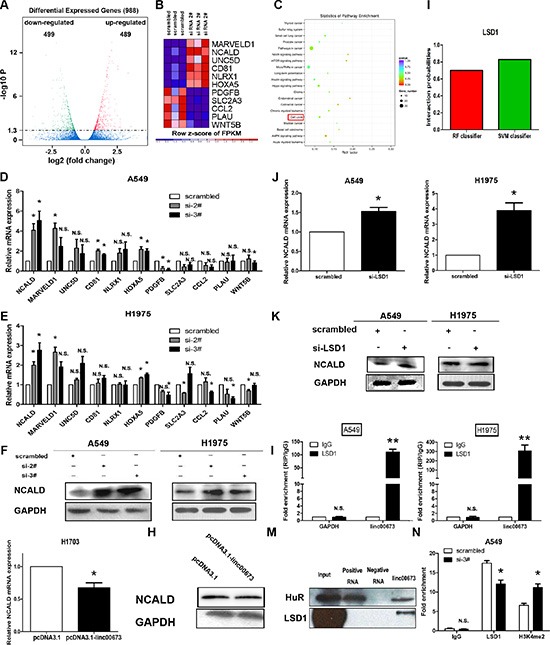
(A) RNA transcriptome sequencing analysis was performed to analyze gene expression profiling in A549 cells following linc00673 knockdown. Volcano plot showed the all of different expressed gene. (A) Expression heatmap of 11 significant different expressed transcripts after the transduction of siRNA linc00673 2#. Expression profiles of the 11 probes in cells with scramble siRNA (left) and with linc00673 knockdown (right) are shown. Red and blue indicate up- and down-regulation, respectively. (C) KEGG pathway analysis for all genes with altered expressions between the negative control group and linc00673 knockdown group cells in vitro. (D and E) QRT-PCR analysis of the mRNA expression levels of tumor suppressor genes and oncogenes in control (scrambled) vs si linc00673 (si-2# and si-3#)-treated NSCLC cells. (F) Western blot analysis of NCALD protein level in A549 and H1975 cells. GAPDH protein expression was used as an internal control. (G and H) QRT-PCR analysis and western blot analysis of NCALD mRNA and protein level in control (pcDNA3.1) vs linc00673 overexpression. (I) The prediction of the interaction probabilities of linc00673 with RNA binding protein (LSD1) via RNA-Protein interaction prediction (http://pridb.gdcb.iastate.edu/RPISeq/). (J and K) QRT-PCR analysis and western blot analysis of NCALD mRNA and protein level in A549 and H1975 after LSD1 knockdown. (L) RIP with rabbit monoclonal anti-LSD1 and preimmune IgG from A549 (left) and H1975 (right) cell extracts. RNA levels in immunoprecipitates were determined by qPCR. Expression levels of linc00673 RNA were presented as fold enrichment in LSD1 relative to IgG immunoprecipitates. (M) Biotinylated linc00673 RNA pulls down the LSD1 protein detected by western blot analysis. HuR as a positive control. (N) ChIP–qRT-PCR of LSD1 occupancy and H3K4-me2 binding in the NCALD promoter in A549 cells treated with linc00673 siRNA (48 hours) or scrambled siRNA. The data represent the mean ± SD from three independent experiments. *P < 0.05, **P < 0.01.