


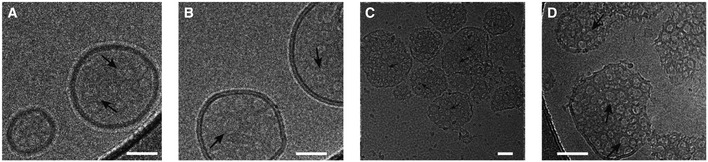
Figure 5. Visualization of GSDMD Nterm pores in liposomes by cryo‐electron microscopy.
-
A–CCryo‐electron micrographs of GSDMDNterm pores in E. coli polar lipid liposomes. The micrographs were acquired at protein/lipid molar ratios of 1/1,000, 1/500, and 1/100, respectively. Black arrows indicate ring‐shaped structures corresponding to oligomeric GSDMDNterm pore forms. Scale bars = 80 nm.
-
DProteoliposome with protein/lipid molar ratio of 1/100 at higher magnification. Black arrows indicate ring‐shaped structures corresponding to oligomeric GSDMDNterm pore forms. Scale bar = 80 nm.