


Figure 2.
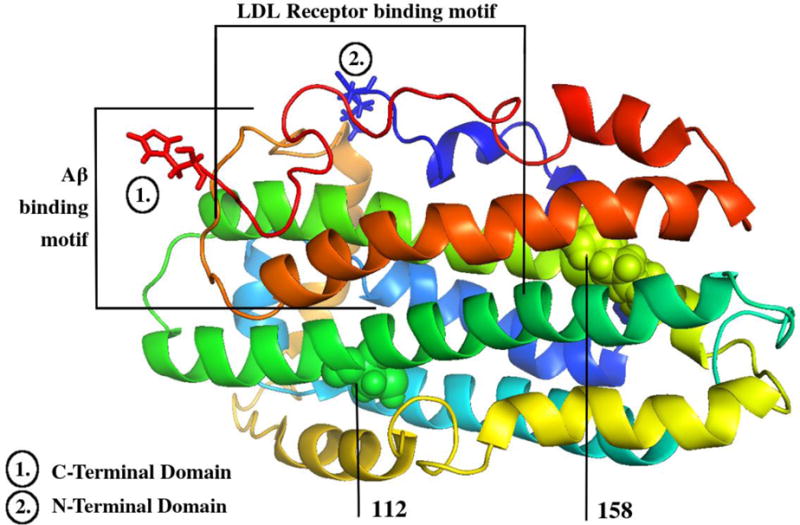
ApoE NMR protein structure. Created from the RCSB Protein Databank and the PyMol graphics viewer (PDB ID: PO2649) [186]. This figure shows the nuclear magnetic resonance protein structure of apoE ɛ3. Lipoprotein binding (1) and Aβ-binding (2) motif regions are delineated [34, 78]. Residues 112 and 158, which are altered between (and therefore determine) the differing isoforms, are also labeled [42–43].