


Extended Data Figure 6. Regional association plots for four of the ten prioritized SNPs for MHBA phenotypes identified using EduYears as a proxy phenotype.
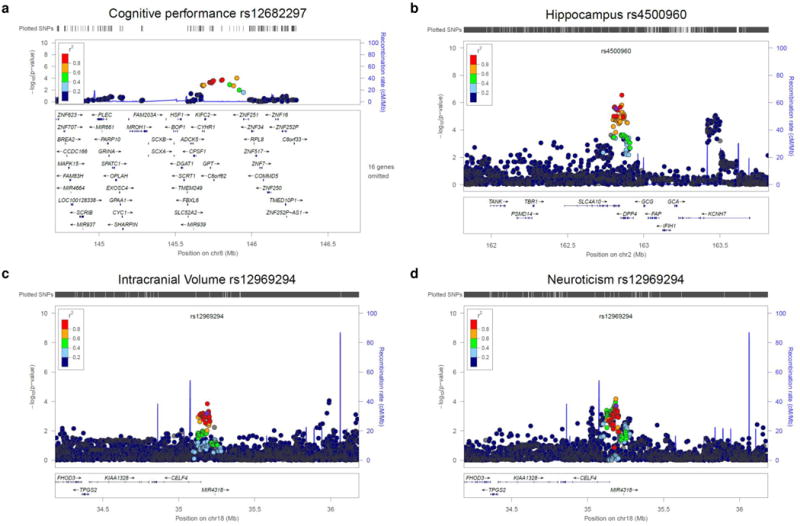
a, cognitive performance; b, hippocampus; c, intracranial volume; d, neuroticism. The four were selected because very few genome-wide significant SNPs have been previously reported for these traits. Data sources and methods are described in Supplementary Information section 3. The R2 values are from the hg19 / 1000 Genomes Nov 2014 EUR references samples. The figures were created with LocusZoom (http://csg.sph.umich.edu/locuszoom/). Mb, megabases.