


Extended Figure 10. The predictive power of a polygenic score (PGS) varies in Sweden by birth cohort.
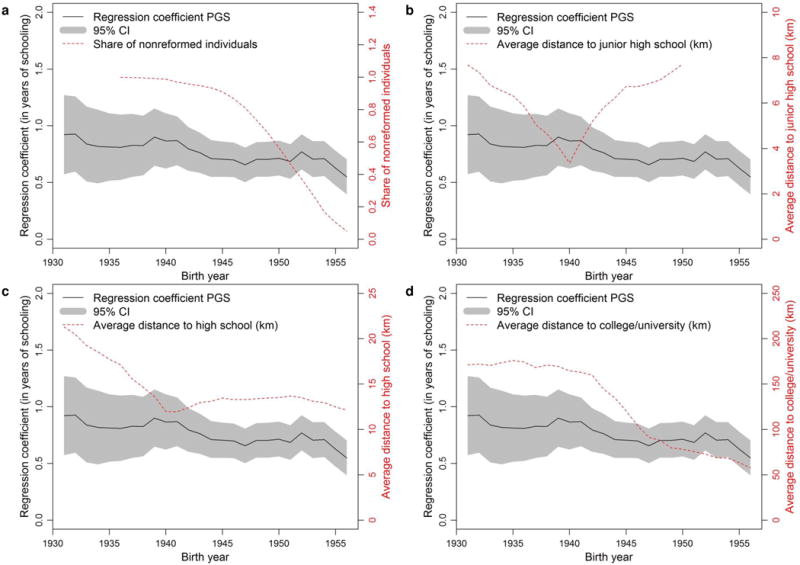
Five-year rolling regressions of years of education on the PGS (left axis in all four panels), share of individuals not affected by the comprehensive school reform (a, right axis), and average distance to nearest junior high school (b, right axis), nearest high school (c, right axis) and nearest college/university (d, right axis). The shaded area displays the 95% confidence intervals for the PGS effect.