


Extended Data 1.
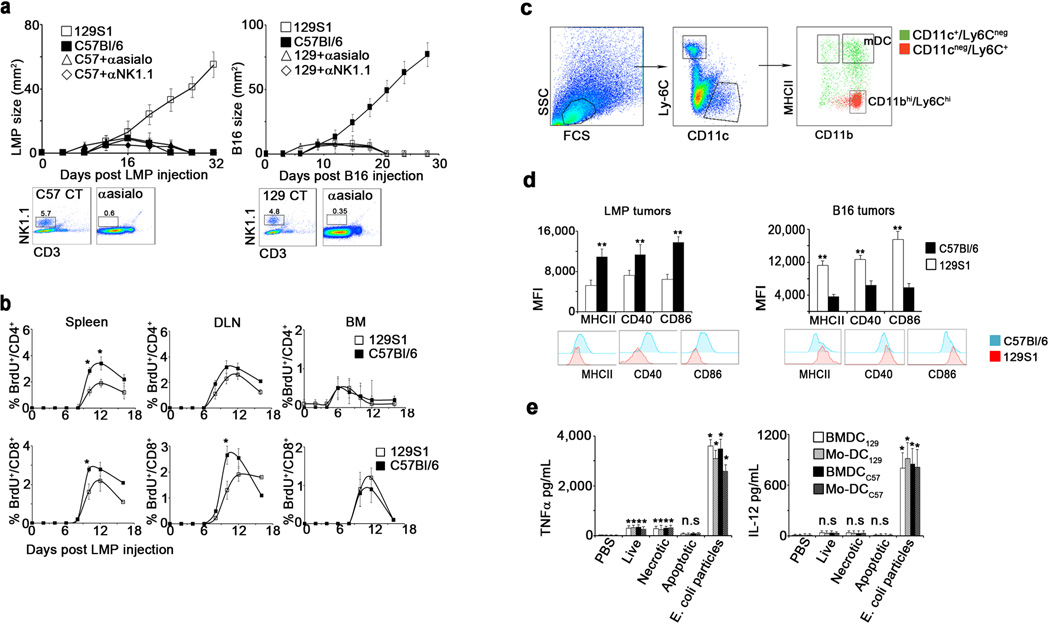
a. LMP (left) and B16 (right) growth in 129S1 ( ) C57Bl/6 (
 ), or allogeneic hosts pretreated with anti-asialo-GM1 (
 ) or anti-NK1.1 antibodies (
 ) (n=6). Shown are representative plots of NK cells in the blood prior to tumor challenge. b. BrdU incorporation by CD4+ T cells (top graphs) and CD8+ T cells (bottom graphs) in lymphoid organs of 129S1 () and C57Bl/6 () LMP-bearing mice (n=8). c. Representative flow cytometric analysis of CD11bhi/Ly6Chi myeloid cells and mature DC (mDC) on day 10 after C57Bl/6 mice were inoculated with B16 tumor cells. d. Flow cytometric analysis of Ly6Cneg/CD11c+/MHCII+ cells from LMP-bearing mice (left panel) and B16-bearing mice (right panel). Histograms show representative expression levels of co-stimulatory molecules on DC from C57Bl/6 (
 ) and 129S1 mice (
 ) (n=8). e. IL-12 (right) and TNFα (left) in the supernatants of syngeneic BMDC (), syngeneic blood monocyte-derived (Mo)-DC (
 ), allogeneic BMDC (
 ) or Mo-DC (
 ) incubated with live, frozen-thawed (necrotic), or mitomycin C-treated (apoptotic) LMP cells or E. coli BioParticles overnight (n=8). Shown are the mean values ±SEM from two independent experiments. Asterisk (*) denotes p<0.05 and two asterisks (**) denote p<0.01.