


Figure 1.
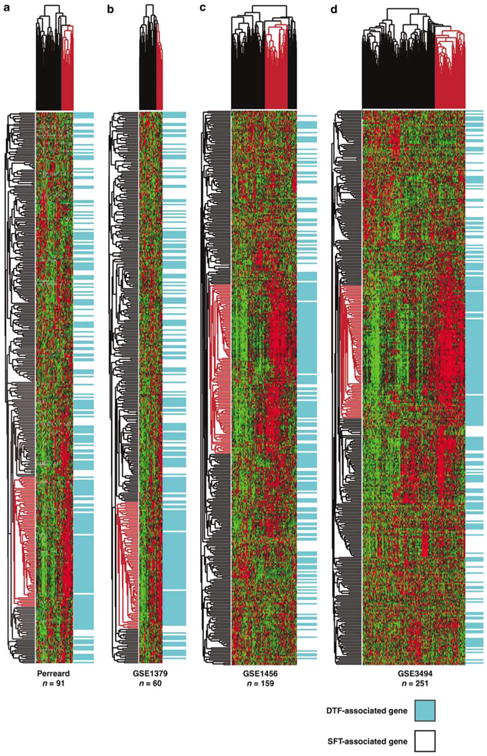
Unsupervised hierarchical clustering of breast carcinomas with DTF- and SFT-associated genes. (a) Perreard (n = 91); (b) GSE1379 (n = 60); (c) GSE1456 (n = 159); and (d) GSE3494 (n = 251). Uncentered Pearson correlation was used as the distance metric with average linkage for the unsupervised hierarchical clustering. Within the heatmap, red represents high expression, black represents median expression, and green represents low expression. The sidebar on the right of each heatmap indicates whether a gene is associated with DTF (blue) or SFT (white). The red-highlighted region of the dendrogram to the left of the heatmaps indicates the DTF core gene cluster within each data set, and the red-highlighted region of the dendrogram above the heatmaps indicates the DTF-like breast cancer case cluster within each data set. The heatmap dendrograms of the gene expression of the DTF and SFT genes in the NKI data set was published previously.6