



Abstract
Activation of oncogenes by mechanisms other than genetic aberrations such as mutations, translocations, or amplifications is largely undefined. Here we report a novel isoform of the anaplastic lymphoma kinase (ALK) that is expressed in ~ 11% of melanomas and sporadically in other human cancer types, but not in normal tissues. The novel ALK transcript initiates from a de novo alternative transcription initiation (ATI) site in ALK intron 19, and was termed ALKATI. In ALKATI-expressing tumours, the ATI site is enriched for H3K4me3 and RNA polymerase II, chromatin marks characteristic of active transcription initiation sites1. ALKATI is expressed from both ALK alleles, and no recurrent genetic aberrations are found at the ALK locus, indicating that the transcriptional activation is independent of genetic aberrations at the ALK locus. The ALKATI transcript encodes three proteins with molecular weights of 61.1, 60.8 and 58.7 kilodaltons, consisting primarily of the intracellular tyrosine kinase domain. ALKATI stimulates multiple oncogenic signalling pathways, drives growth-factor-independent cell proliferation in vitro, and promotes tumorigenesis in vivo in mouse models. ALK inhibitors can suppress the kinase activity of ALKATI, suggesting that patients with ALKATI-expressing tumours may benefit from ALK inhibitors. Our findings suggest a novel mechanism of oncogene activation in cancer through de novo alternative transcription initiation.
To identify novel mechanisms of oncogene activation, we performed transcriptome analyses (RNA sequencing (RNA-seq)) of metastatic melanoma and thyroid carcinoma. We used an algorithm2 to investigate the differential expression of exons and focused our analysis on receptor tyrosine kinases with high expression of the kinase domain. In two melanoma (MM-15, MM-74) and one anaplastic thyroid carcinoma (ATC-28) samples, we identified a novel ALK transcript, which contained the ALK exons 20–29 preceded by ~400 base pairs (bp) of intron 19, but not exons 1–19. The novel ALK transcript was distinct from wild-type ALK, which contains all exons, and from ALK translocations, which usually encompass exons 20–29 with little intronic expression due to preserved splice sites (Fig. 1a and Extended Data Fig. 1a–c). We confirmed the presence of the novel ALK transcript with a northern blot (Extended Data Fig. 2a, b).
Figure 1. Alternative transcription initiation (ATI) results in a novel ALK transcript.

a, Distribution of RNA-seq reads of ALK variant transcripts: ALKATI RNA-seq reads align to both ALK intron 19 and exons 20–29; full-length, wild-type ALK (ALKWT) RNA-seq reads align to all ALK exons, but not to the introns; translocated ALK RNA-seq reads align only to ALK exons 20–29. b, Mapping of the ATI sites of ALKATI to a 25 bp region in ALK intron 19 (hg19 ch2:29,446,768–29,446,744; blue shaded area). c, ChIP-seq profile of H3K4me3 at the ATI site. d, Quantitative mRNA profiling of different ALK variants using Nanostring nCounter: 2 wild-type ALK-expressing neuroblastoma cell lines (SK-N-BE2 and SK-N-DZ), 2 EML4–ALK-expressing lung cancer cell lines (H3122 and H2228), 9 ALKATI-expressing tumours (8 melanomas (MM) and 1 anaplastic thyroid carcinoma, ATC-28). e, Similar SNV frequencies in DNA-seq, RNA-seq, and ChIP-seq (H3K4me3) data indicate that ALKATI is biallelically expressed.
The RNA-seq profile of the novel ALK transcript suggested an alternative transcription initiation site in intron 19, and we termed the novel transcript ALKATI. We performed 5′-rapid amplification of cDNA ends (5′-RACE) and mapped the ATI site to a 25 bp region in intron 19 (Fig. 1b, Extended Data Fig. 2c–e and Supplementary Table 1). ChIP-seq and ChIP-qPCR showed that only ALKATI-expressing tumours, but not controls, had significant enrichment of histone H3K4me3 and RNA polymerase II (RNApol II) at the ATI site, which are typical of active promoters1 (Fig. 1c and Extended Data Fig. 3a, b). These data suggest that ALKATI originates from a newly established bona fide ATI site associated with characteristic chromatin alterations.
To determine the prevalence of ALKATI expression, we screened more than 5,000 samples from 15 different cancer types in the TCGA RNA-seq data set. ALKATI was expressed in ~ 11% of melanoma and sporadically in other cancer types (Extended Data Table 1). We found no ALKATI expression in more than 1,600 samples from 43 different normal tissues in the Genotype-Tissue Expression (GTEx) RNA-seq data set3, indicating that ALKATI is primarily expressed in a subset of cancer. To accurately distinguish and quantify the expression of ALKATI, wild-type ALK, and translocated ALK in clinical specimens, we developed a NanoString nCounter assay4 with probes in ALK exons 1–19, intron 19, and exons 20–29, and identified additional ALKATI-expressing tumours derived from formalin-fixed paraffin-embedded clinical specimens (Fig. 1d).
To determine whether somatic genomic aberrations at the ALK locus contribute to the establishment of the de novo ATI site, we performed comprehensive genetic analyses including interphase fluorescence in situ hybridization (FISH), array comparative genomic hybridization (aCGH), whole-genome sequencing, and ultra-deep sequencing of the ALK locus, but found no genomic aberrations that could account for the de novo expression of ALKATI (Extended Data Figs 4a–d and 5a–c, and Supplementary Tables 2–4). Reasoning that local genomic aberrations are usually cis-acting and only alter the expression of the affected allele5, we analysed the single nucleotide variants (SNVs) in the DNA-, RNA-, and ChIP-seq data. In all three data sets, we found similar allelic SNV frequencies, indicating that H3K4me3 decorates both ALK alleles and that both ALK alleles are actively transcribed (Fig. 1e). These data suggest that the transcriptional activation of ALKATI is independent of genomic aberrations at the ALK locus, and that alteration of trans-acting elements, such as transcription factors or chromatin modifiers, may contribute to ALKATI expression.
The ATI region contains transposable elements, including a long terminal repeat (LTR) in ALK intron 19 and a long interspersed nuclear element (LINE) in intron 18, both of which can regulate transcription6 (Extended Data Fig. 6a). To evaluate whether CpG methylation of these elements might be associated with ALKATI expression, we performed bisulfite sequencing. Compared to the controls, the ALKATI-expressing samples showed lower CpG methylation in regions flanking the ATI site, including the LINE (Extended Data Fig. 6b–d). The LTR contained only few CpG sites with low methylation levels in all samples. As expected, we found H3K27ac, a histone mark characteristic of active promoters and enhancers, enriched at the ATI site of ALKATI-expressing tumour samples. Surprisingly, H3K27ac was also enriched in ALKATI-negative melanoma samples, but not in the control lung cancer cell lines or the 17 non-melanoma cell lines analysed by the ENCODE consortium7 (Extended Data Fig. 6e, f). By integrating ChIP, DNase I hypersensitivity, and 5′-RACE data, we defined the proximal cis-regulatory region on chromosome 2 as chr2:29,445,000–29,447,100 and computationally determined the potential transcription factor binding motifs8 (Supplementary Table 5). To test whether the LTR could function as a promoter, we used a luciferase reporter assay and found that, in contrast to lung cancer cell lines, melanoma cell lines showed low but consistent luciferase activity (Extended Data Fig. 6g). These data suggest that melanomas with H3K27ac enrichment at the ATI site might be primed to express ALKATI.
The ALKATI transcript has three predicted in-frame start codons (ATGs), resulting in proteins with molecular weights of 61.1, 60.8, and 58.7 kilodaltons (kDa). All three proteins maintain the intracellular tyrosine kinase domain, but lack the extracellular and transmembrane domains of wild-type ALK (Fig. 2a). Immunoblots of two neuroblastoma cell lines (SK-N-BE2, SK-N-DZ) expressing wild-type ALK and two lung cancer cell lines (H3122 and H2228) expressing two distinct variants of the EML4–ALK gene fusion showed bands at the expected sizes. ALKATI-expressing tumours revealed a double band at ~ 60 kDa, suggesting that ALKATI is translated from more than one start codon (Fig. 2b). To confirm our prediction, we mutated the three start codons individually or in combination, and expressed them in 293T cells. Immunoblots revealed that each mutated form of ALKATI no longer produced the corresponding protein band, indicating that all three start codons in ALKATI are functional and give rise to three distinct proteins (Fig. 2c).
Figure 2. The ALKATI transcript encodes three ALK proteins mainly containing the kinase domain.

a, Illustration of ALK protein isoforms. MAM, meprin, A-5 protein, and receptor protein-tyrosine phosphatase mu; Gly, glycine-rich region. b, Immunoblots of total (t) and phosphorylated (p) ALK in two ALK-expressing neuroblastoma cell lines, two EML4–ALK variant-expressing lung cancer cell lines, three ALKATI-expressing tumours, and a negative control melanoma cell line. c, Immunoblots of 293T cells with transient expression of ALKATI, in which the three predicted start codons were mutated from ATG to AAG, individually or in combination as indicated. KD, kinase-dead. d, Co-immunoprecipitation (IP) and immunoblots (IB) in 293T cells expressing V5-tagged ALKATI (V5–ALKATI), HA-tagged ALKATI (HA–ALKATI), or both. e, ALK immunofluorescence in NIH-3T3 cells expressing the indicated ALK isoforms. Scale bar, 25 mM. f, Haematoxylin and eosin (H&E) staining and ALK immunohistochemistry in ALKATI-expressing human tumour samples. Scale bar, 50 μm. See Supplementary Fig. 1 for uncropped blots from b–d.
ALKATI proteins were phosphorylated in tumours with endogenous ALKATI expression and in cells with exogenous ALKATI expression (Fig. 2b, c), indicating that ALKATI is active. ALK activity was confirmed by an in vitro kinase assay (Extended Data Fig. 7a). A kinase-dead ALKATI (ALKATI-KD), in which a lysine in the ATP-binding site of the kinase domain was replaced by a methionine9, was not phosphorylated or active. Reasoning that ALKATI may auto-activate by forming homodimers similar to other receptor tyrosine kinases10, we tested the ability of self-interaction using co-immunoprecipitation with V5- and HA-tagged ALKATI proteins. The V5–ALKATI readily co-immunoprecipitated with the HA–ALKATI and vice versa, indicating that ALKATI can self-interact, resulting in auto-phosphorylation and kinase activity (Fig. 2d). Using immunofluorescence, we detected ALKATI in both the nucleus and the cytoplasm, whereas ALK with the F1174L mutation (ALKF1174) and EML4–ALK were found mainly in the cytoplasm and/or at the cell membrane (Fig. 2e). ALK immunohistochemistry in clinical samples confirmed the nuclear and cytoplasmic localization of ALKATI, suggesting that detection of nuclear ALK expression by immunohistochemistry could be used as a simple bio-marker to identify ALKATI-expressing tumours (Fig. 2f and Extended Data Fig. 7b).
To establish the functional consequences of ALKATI expression, we stably transduced Ba/F3, NIH-3T3 and melan-a cells with ALKATI, negative controls (ALKATI-KD and empty vector), and positive controls (oncogenic ALK variants ALKF1174L, EML4–ALK, and wild type). In interleukin 3 (IL-3)-dependent Ba/F3 cells, expression of ALKATI and the positive controls, but not the negative controls, led to IL-3-independent proliferation (Fig. 3a). We confirmed that ALKATI was expressed at similar levels in the transformed ALKATI-Ba/F3 cells to those in human tumours, and that all ALK isoforms were phosphorylated when expressed at levels required for IL-3-independent growth (Fig. 3b). In competition assays, only Ba/F3 cells expressing green fluorescent protein (GFP) co-expressed from the ALK expression vectors were growing under IL-3-independent growth conditions, indicating that the Ba/F3 cell transformation was driven by expression of the ALK variants (Extended Data Fig. 7c). Consistently, ALKATI-expressing NIH-3T3 and melan-a cells efficiently induced tumour growth in mice with severe combined immunodeficiency (SCID) (Fig. 3c and Extended Data Fig. 7d–f).
Figure 3. ALKATI promotes growth-factor-independent proliferation in vitro and tumorigenesis in vivo.

a, Growth curves of Ba/F3 cells stably expressing the indicated ALK isoforms in the absence of IL-3. Error bars, mean ± s.d.; n = 8, pooled data from 2 experiments with 4 technical replicates each. b, ALK immunoblots of previously transformed (capable of IL-3- independent growth) Ba/F3 cells with exogenous expression of the indicated ALK isoforms, and of tumours with endogenous ALKATI expression. See Supplementary Fig. 1 for uncropped blots. c, Tumour growth of NIH-3T3 cells stably expressing the indicated ALK isoforms. Error bars, mean ± s.e.m.; n = 10 tumours, see also Source Data associated with this figure.
All cells expressing ALK variants (ALKATI, ALKF1174L, EML4–ALK, and wild-type ALK) were able to establish growth-factor-independent proliferation and tumorigenesis with similar growth rates once the tumours were established. The observed oncogenic capacity of wild-type ALK is consistent with previous reports that high endogenous expression or genomic amplification of ALK drives oncogenesis and confers sensitivity to ALK inhibitors in neuroblastomas11–16. To explore the functional consequences of ALKATI expression further, we stably transduced NIH-3T3 cells with either a low or high titre of ALKATI, resulting in cells expressing ALKATI either at low or at high levels. We found that a further increase in ALKATI expression levels did not accelerate tumour graft establishment and growth, indicating that ALKATI can drive tumorigenesis once a threshold of expression is reached (Extended Data Fig. 7g–i).
To examine the therapeutic responses to pharmacological ALK inhibition, we treated Ba/F3 cells stably expressing various ALK isoforms with three different ALK inhibitors (crizotinib, ceritinib, and TAE-684). All three ALK inhibitors effectively inhibited IL-3-independent growth of the transformed Ba/F3 cells, whereas they had no effect on growth in the presence of IL-3 (Fig. 4a and Extended Data Fig. 8a, b). Crizotinib inhibited ALKATI phosphorylation and downstream signalling in a concentration-dependent manner, further corroborating that ALKATI is activated through auto-phosphorylation (Fig. 4b and Extended Data Fig. 8c–e). Crizotinib treatment induced regression of ALKATI-driven NIH-3T3 tumours in vivo, and immunohistochemistry of explanted tumours confirmed reduced cell proliferation, increased apoptosis, and inhibition of several oncogenic signalling pathways (Fig. 4c–e and Extended Data Fig. 9a–f).
Figure 4. ALKATI expression confers sensitivity to ALK inhibitors in vitro and in vivo.
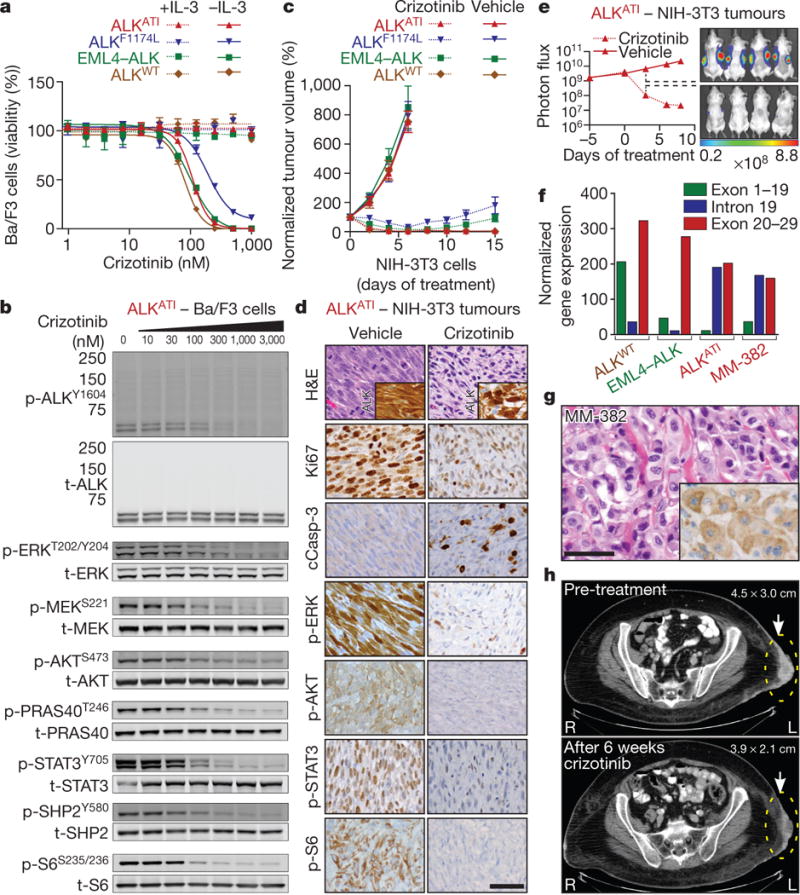
a, Dose–response curves to crizotinib of Ba/F3 cells expressing the indicated ALK isoforms in the presence or absence of IL-3. Error bars, mean ± s.e.m.; n = 3 biological replicates. b, Representative immunoblots of ALKATI-expressing Ba/F3 cells treated with increasing concentrations of crizotinib for 2 h. See Supplementary Fig. 1 for uncropped blots. c, Normalized tumour volume in mice implanted with NIH-3T3 cells expressing the indicated ALK isoforms and treated with vehicle (n = 8 tumours) or crizotinib (n = 10 tumours). Error bars, mean ± s.e.m.; see also Source Data. d, H&E staining and immunohistochemistry of explanted ALKATI-expressing tumours 48 h after first crizotinib treatment. e, Normalized bioluminescence signal of ALKATI-expressing, luciferase-labelled NIH-3T3 tumours treated with vehicle or crizotinib. Error bars, mean ± s.e.m.; n = 8 tumours; see also Source Data associated with this figure. f, Quantitative mRNA ALK profiling of a metastatic melanoma (MM-382) compared to wild-type ALK, EML4–ALK, or ALKATI using Nanostring nCounter. g, H&E staining and ALK immunohistochemistry (inset) of MM-382. Scale bars in d and g, 50 μm. h, Computed tomography images of a subcutaneous melanoma metastasis from patient 1 (MM-382) before and after crizotinib treatment.
On the basis of our pre-clinical data, we identified a patient with ALKATI-expressing metastatic melanoma (Fig. 4f, g). A clinical sequencing assay17, which evaluates 341 cancer-related genes for genomic aberrations, and FISH to assess ALK rearrangements and MET amplifications, revealed deletions of CDKN2A and PTEN (Extended Data Fig. 9g–i). The patient had previously progressed on a combination of ipilimumab and nivolumab immunotherapy in a clinical trial, followed by palliative radiation and dacarbazine chemotherapy. Subsequent treatment with crizotinib resulted in marked symptomatic improvement and tumour shrinkage within 6 weeks of therapy (Fig. 4h).
Taken together, we have identified a novel ALK transcript, ALKATI, which arises independently of genomic aberrations at the ALK locus through alternative transcription initiation. ALKATI-driven tumours are sensitive to ALK inhibitors, suggesting that patients harbouring such tumours may benefit from ALK inhibitor therapy. Importantly, we have discovered alternative transcription initiation as a novel mechanism for oncogene activation. Additional oncogenes may be activated via similar mechanisms in other human malignancies, and their identification may provide new insights into oncogenesis and opportunities for therapeutic intervention.
METHODS
No statistical methods were used to predetermine sample size.
Human tumour samples
The study was approved by the Institutional Review Boards and Ethics Committees of Memorial Sloan Kettering Cancer Center, New York and informed consent was obtained from all subjects (#12–245 and #00–144). Representative portions of excised tumours were snap-frozen in liquid nitrogen, or fixed in 4% neutral buffered formalin, embedded in paraffin, and processed using routine histological methods and stained with haematoxylin and eosin.
RNA sequencing
Total RNA was extracted from fresh-frozen tissue sections (17 metastatic melanomas and 6 thyroid carcinomas) using an RNeasy Mini Kit (Qiagen). The isolated RNA was processed using the TruSeq RNA sample Prep kit (Illumina) according to the manufacturer’s protocol. The libraries were sequenced on an Illumina HiSeq 2500 platform with 50, 75, or 100bp paired-end reads to obtain on average 40,000,000–100,000,000 reads per sample. Sequencing data was mapped to hg19, and analysed using publicly available software packages: SAMtools18, Tophat19, GATK20, Picard (http://picard.sourcefor-ge.net), and IGV21.
Screening for aberrantly expressed kinases
For initial screening of RNA-seq data, candidate receptor tyrosine kinase (RTK) genes were defined by Gene Ontology annotation GO:0004714 as found in AmiGO22. DEXSeq2 was used to calculate exon level counts using RTK Ensembl Gene IDs. For each gene the ratio of reads in the first half of the gene to the second half was calculated. ALK was identified as the top hit.
Analysis of public data sets
RNA-seq data were downloaded from the Broad Institute GTEx Genotype-Tissue Expression Portal (http://www.broadinstitute.org/gtex/). Level 3 TCGA data was downloaded from the Broad Institute TCGA GDAC Firehose (http://gdac.broadinstitute.org/) 2013_09_23 run using exon_quantification data from illuminahiseq_rnaseqv2__unc_udu. ALKATI candidates were identified as samples with an ALK expression level of RSEM ≥100, ≥ 500 total reads across all ALK exons, and ≥10-fold greater average expression in exons 20–29 compared to exons 1–19. To confirm ALKATI expression, candidates were manually examined in IGV21. ENCODE ChIP-seq data for H3K27ac, mapped to hg19 and converted to bigwig track format, was downloaded from http://genome.ucsc.edu/ENCODE/dataMatrix/encodeChipMatrixHuman.html.
Promoter/motif analysis
The proximal cis-regulatory region, chr2:29,445,000–29,447,100, was scanned for transcription factor motifs using FIMO8 with default parameters against the known vertebrate transcription factor motifs in the JASPAR database23.
5′-rapid amplification of cDNA ends (5′-RACE)
We used two independent 5′-RACE techniques and three ALKATI-expressing tumours (MM-15, MM-74, and ATC-28) to map the ATI site and the 5′-end of the ALKATI transcript. We applied a tobacco-acid-pyrophosphatase 5′-RACE technique according to the manufacturer’s protocol (Epicentre) using the following primers: 5′-TCATACACATACGATTTAGGTGACACTATAGAGCGGCCGCCTGCAGGAAA-3′; 5′-CAGGTCACTGATGGAGGAGGTCTTGCCAGCAAAGCA-3′. RACE products were sequenced on an Illumina MiSeq System with a 150 bp paired-end protocol according to the manufacturer’s instructions. The sequencing reads were mapped to hg19 using BWA and visualized using IGV21. We confirmed the continuous transcription starting in ALK intron 19 with an independent oligonucleotide-based 5′-RACE kit (Clontech) according to the manufacturer’s protocol using the primers 5′-CTAATACGACTCACTATAGGGC-3′, 5′-ACACCTGGCCTTCATACACCTCC-3′. We cloned the RACE cDNA products into plasmids (Invitrogen) and analysed them with Sanger sequencing. Two lung cancer cell lines (H3122 and H2228) with EML4–ALK translocations were used as controls.
Chromatin immunoprecipitation sequencing (ChIP-seq) and ChIP-qPCR
Chromatin was isolated from human tumour tissue and cell lines. Fresh-frozen human tumour tissue (MM-15, MM-74, and ATC-28) was sectioned with a microtome and cross-linked in 1% paraformaldehyde for 15 min. The cross-linked tissue samples were quenched in 125 mM glycine, washed in PBS, re-suspended in lysis buffer, ground in a Tenbroeck-style tissue grinder, and sonicated. Chromatin isolation from cell lines and immunoprecipitation was performed as previously described24. Solubilized chromatin was immunoprecipitated with antibodies against H3K4me3, H3K27ac, and RNApol II (all Active Motif). Sequencing was performed on an Illumina HiSeq 2500 with 51 bp single reads. Reads were aligned to hg19 using Bowtie within the Illumina Analysis Pipeline. Peak calling was performed using MACS 1.4 comparing immunoprecipitated chromatin with input chromatin25. ChIP-qPCR was performed on a ViiA 7 Real Time PCR System (Life Technologies) using Power SYBR Master Mix (Life Technology) with 3 technical replicates and 5 independent primers pairs, which are specified in Supplementary Table 6.
Ultra-deep targeted sequencing of the entire ALK locus and MSK-IMPACT
Targeted sequencing of the entire ALK locus was performed using custom hybridization capture probes tiling hg19 chr2:29,400,000–30,300,000 (Roche/NimbleGen’s SeqCap EZ). This region encompassed the entire genomic footprint of ALK and ~ 150 kb of upstream sequence. After the genomic DNA was fragmented (E220, Covaris), we prepared barcoded sequence libraries (New England Biolabs, Kapa Biosystems) and performed hybridization capture on barcoded pools. Using 250 ng of genomic DNA, we constructed libraries from 7 separate samples: 2 melanomas (MM-15 and MM-74), 1 anaplastic thyroid carcinoma (ATC-28), 2 lung cancer cell lines (H3122 and H2228) with EML4–ALK translocations, 1 melanoma cell line (SKMEL-28), and 1 control pool of 10 ‘normal’ blood samples. Libraries were pooled at equimolar concentrations (100 ng per library) and used in the capture reaction as previously described26. To prevent off-target hybridization, we added a pool of spike-in blocker oligonucleotides complementary to the full sequences of all barcoded adaptors. The captured libraries were sequenced on an Illumina HiSeq 2500 to generate 75 bp paired-end reads. Sequence data were de-multiplexed using CASAVA, and aligned to hg19 using BWA27. Local realignment and quality score recalibration were performed using the Genome Analysis Toolkit (GATK) according to GATK best practices28. We achieved mean unique target sequence coverage of 1,778 × per sample (range: 1,293–2,188×). Sequence data were analysed to identify single nucleotide variants, small insertions/deletions (indels), and structural rearrangements. Single nucleotide variants were called using muTect29 and were compared to the negative control pool (pooled ‘normal’ blood samples). Variants were retained if the variant allele frequency in the tumour was >5 times than in the negative control and the frequency in the negative control was <0.02. Validated SNPs in the dbSNP database were filtered out. Indels were called using the SomaticIndelDetector tool in GATK28 and were retained if the tumour harboured >3 supporting reads and the frequency in the negative control was <0.02. DELLY was used to search for structural rearrangements30. Memorial Sloan Kettering-Integrated Mutation Profiling of Actionable Cancer Targets (MSK-IMPACT) was performed as described previously17.
Bisulfite sequencing of the entire ALK locus
We performed custom capture of the entire ALK locus using custom hybridization capture probes tiling the entire genomic footprint of ALK (900 kb, chr2:29,400,000–30,300,000) followed by bisulfite sequencing. After fragmentation (E220, Covaris) of 3 μg genomic DNA of each sample (MM-15, ATC-28, H3122, and SKMEL-28), libraries were prepared with the KAPA Hyper Prep Kit (Kapa Biosystems) without PCR amplification to preserve the methylation status. Of each barcoded library, 1 μg was pooled at equimolar concentrations and captured according to the manufacturer’s protocol (Roche/NimbleGen’s SeqCap EZ). After washing the Dynabeads M-270 (Life Technologies), the non-biotinylated tumour/cell line DNA was dissociated from the biotinylated capture beads with 0.5MNaOH. The single-stranded eluted DNA was used for bisulfite conversion using the EZ DNA Methylation-Gold Kit (Zymo Research) according to the manufacturer’s protocol, except for the 98 °C denaturation step. After bisulfite conversion, we used the KAPA HiFi Uracil PCR polymerase (Kapa Biosystems) to amplify the library, purified the reaction with Agencourt AMPure XP beads (A63881, Beckman Coulter), and sequenced the library on an Illumina MiSeq with a 150 bp paired-end protocol according to the manufacturer’s instructions. Sequence data were aligned to hg19 and analysed using Bismark31. We compared the methylation level at CpG sites across all samples; no methylation was detected in the CHG and CHH contexts. Methylation was first computed as the number of methylated CpG reads vs the number of total reads covering each CpG site (sites with < 10 reads were excluded). A sliding window was used to determine the mean methylation level for every 250 bp region (with at least three CpGs) near the ALK promoter region (chr2:29,444,000–29,452,000). Differential methylation was evaluated using a Mann–Whitney test.
Whole-genome sequencing
Whole-genome sequencing was performed at the New York Genome Center. Briefly, genomic DNA libraries were prepared from MM-15 and ATC-28 (no matched normal DNA was available) using the Illumina PCR-free kit. Libraries were sequenced on an Illumina HiSeq 2500 using the 100bp paired-end whole-genome sequencing protocol. Sequence reads were mapped using BWA27 and processed using GATK28. Genome-wide analyses of mutations (HaplotypeCaller28), copy number alterations (FREEC)32, and structural variations (CREST)33 were performed. Mutations were annotated with the Ensembl Variant Effect Predictor34 and filtered to remove common polymorphisms. Non-synonymous mutations along with copy number alterations and structural variations were visualized using Circos35.
Allelic frequencies SNVs at the ALK locus
DNA-seq, RNA-seq, and ChIP-seq (H3K4me3) data were displayed in the Integrative Genomics Viewer and the allelic frequencies were compared for each single nucleotide variant (SNV).
Array CGH
Genome-wide analysis of DNA copy number changes was conducted using an oligonucleotide SurePrint G3 Human CGH Microarray (Agilent) containing 1,000,000 probes. Slides were scanned using a microarray scanner G2505B (Agilent) and analysed using Genomic Workbench (Agilent).
Interphase fluorescence in situ hybridization (FISH)
ALK break-apart probes and locus-specific probes for MET and for centromere 7 were purchased from Abbott. The probes were hybridized on 5-μm-thick tissue sections and the number and localization of the hybridization signals was assessed in a minimum of 100 interphase nuclei with well-delineated contours.
Northern blots
Total RNA was extracted from fresh-frozen tissue or cell lines using Qiagen’s RNeasy Mini Kit (Qiagen). Up to 10 μg RNA was used for running formaldehyde-based northern blot analysis according to the manufacturer’s protocol using the RNA Ambion NorthernMax Kit (Ambion). After hybridization with a32 P-labelled probe, consisting of ALK exon 20–29, the membrane was washed and visualized.
NanoString
Details of the nCounter Analysis System (NanoString Technologies) were reported previously36. In brief, two sequence-specific probes were constructed for ALK exons 1–19, intron 19, and exons 20–29, respectively. Four control genes (RPS13, RPL27, RPS20, and ACTB) were used for normalization. The probes were complementary to a 100 bp region of the target mRNA and are listed in Supplementary Table 7. 100ng of total RNA from each sample was hybridized, the raw data were normalized to the standard curve generated via the nCounter system, and the average value of the two probes in each target region (exons 1–19, intron 19, exons 20–29) was printed in bar charts using GraphPad Prism software 6.0. NanoString experiments were independently performed at least twice with appropriate positive and negative controls, and a representative experiment is shown.
Cell lines
The NIH-3T3 mouse embryonic fibroblast cells (#CRL-1658) and the two neuroblastoma cell lines, SK-N-DZ (#CRL-2149) and SK-N-BE2 (#CRL-2271), were obtained from the American Type Culture Collection (ATCC), and maintained in Dulbecco’s modified eagle medium (DMEM). The lung carcinoma cell lines H2228 (#CRL-5935, ATCC) and H3122 (NCI, Bethesda, MD) were cultured in Roswell Park Memorial Institute medium (RPMI). The IL-3-dependent murine pro B-cell line, Ba/F3, was obtained from the ‘Deutsche Sammlung von Mikroorganismen und Zellkulturen’ (DSMZ) and was cultured in RPMI supplemented with 1 ngml−1 IL-3 (R&D). The melanoma cell lines A375, A2058, and Colo800 were provided by the laboratory of J. Massagué and were cultured in DMEM. The melanoma cell lines 501 mel and WW94 were provided by the laboratory of L. Garraway and were cultured in DMEM. SKMEL-23, SKMEL-28, SKMEL-31, and SKMEL-524 are patient-derived melanoma cell lines established at Memorial Sloan Kettering Cancer Center and were cultured in RPMI. Melan-a cells were provided by D. Bennett (St. George’s Hospital, University of London, London, UK)37 and were maintained in RPMI supplemented with 200 nM 12-O-tetradecanoylphorbol-13-acetate (TPA; Cell Signaling). For retrovirus production, 293T cells were purchased (Clontech) and cultured in DMEM. All cell culture media contained 10% FBS, L-glutamine (2 mM), penicillin (100 Uml−1), and streptomycin (100 μg ml−1). All cells were cultured at 37 °C in 5% CO2 and were biochemically tested negative for mycoplasma contamination every 4–8 weeks (Lonza). After receiving the cell lines from the indicated sources, the cell lines were not further authenticated, but showed the expected genomic aberrations, such as EML4-ALK translocations. The genomic aberrations have been validated by various methods, including RNA-seq or northern blot.
Plasmids
For the ALKATI vector, RNA from MM-15 was reverse-transcribed with anchored oligo(dT) primers into cDNA (Roche), PCR amplified with ALK the primers 5′-CACCATCCCATCTCCAGTCTGCTTC-3′, 5′-AGAGAAGTGAGTGTGCGACC-3′, and cloned into a pENTR vector (Life Technologies). The full-length ALK plasmid (HsCD00079531) was purchased from the DF/HCC DNA Resource Core (http://plasmid.med.harvard.edu) and EML4–ALKv1 was synthesized at GeneArt (Life Technologies). Site-directed mutagenesis was performed using QuikChange (Agilent): for kinase-dead ALKATI (ALKATI-KD), we mutated the lysine in the ATP-binding site of the kinase domain to methionine (p.K1150M referring to wild-type ALK) in ALKATI, and for ALKF1174L a p.F1174L mutation was introduced into wild-type ALK. Plasmids were sub-cloned into pMIG-w backbones38 (http://www.addgene.org), resulting in MSCV-ALKvariant-IRES-GFP constructs, which were confirmed by digestion and sequencing. To confirm the start codons, we mutated the three start codons from ATG to AAG individually or in combination as indicated. For co-immunoprecipitation, ALKATI was subcloned into pcDNA3.1/nV5-Dest (Life Technologies) and MSCV–N-HA–FLAG-Dest (Addgene). For bioluminescence imaging, we used a triple modality retroviral reporter plasmid (red fluorescent protein (RFP)–thymidine-kinase–luciferase)39.
Stable gene expression
Retrovirus was produced in 293T cells by standard methods using ecotropic or amphotropic packaging vectors and XtremeGene 9 (Roche). We harvested the virus-containing supernatant 48, 64 and 72 h after transfection. The supernatant was pooled, filtered through a 0.45 μm PVDF membrane, and used for transduction in the presence of polybrene (8 μg ml−1). Stable eGFP- or RFP-expressing cells were sorted with a FACSAria II (BD Biosciences).
Co-immunoprecipitation
V5–ALKATI and HA–ALKATI was transiently transfected into 293T cells using XtremeGene 9 (Roche), and after 24 h, cells were lysed in 10 mM Tris-HCl (pH 7.5), 1% Triton X-100, 150 mM NaCl, 1 mM EDTA, 1 mM DTT, 1 mM PMSF, and proteinase/phosphatase inhibitors. After incubation and centrifugation, 100 μl supernatant was used as input, and 300 μl for immunoprecipitation using the following antibodies: 2 μg of anti-V5 antibody (Thermo Scientific), 10 μl of EZview Red anti-HA Affinity Gel (Sigma), 2 μg of anti-mouse IgG (Santa Cruz). We used 20 μl of Protein A/G UltraLink Resin (Thermo Scientific) for immunoprecipitation. The immunoprecipitated material was eluted in 4× SDS loading buffer for immunoblotting. Co-immunoprecipitation was independently performed twice and a representative immunoblot is shown in Fig. 2d.
In vitro kinase assay
Stably transduced NIH-3T3 cells were grown in a 15 cm dish, washed with PBS, and lysed in 20mM Tris (pH 8.0), 1% NP-40, 125 mM NaCl, 2.5 mM MgCl2, and 1 mM EDTA with proteinase/phosphatase inhibitor. Lysates were incubated on ice, centrifuged, pre-cleared with 25 μl Protein A/G UltraLink Resin (Thermo Scientific) for 30min at 4 °C under rotation, and immunoprecipitated with 10 μl ALK (D5F3) XP Rabbit monoclonal antibody and 25 μl Protein A/G UltraLink Resin. After rotation for 120 min at 4 °C, the immunoprecipitated material was washed and used according to the instructions of Universal Tyrosine Kinase Assay Kit (Clontech). After the enzymatic reaction, the immunoprecipitated material was mixed with 4×SDS loading buffer for immunoblotting. In vitro kinase assays were performed in quadruplicates, independently repeated three times, and a representative experiment is shown.
Immunohistochemistry
Immunohistochemistry was performed on archival formalin-fixed paraffin-embedded tumour specimens using a standard multimer/diaminobenzidine (DAB) detection protocol on a Discovery Ultra system (Roche/Ventana) with appropriate negative and positive controls. The following antibodies (Cell Signaling Technology) were diluted in SignalStain antibody diluent (Cell Signaling Technology) as indicated: ALK 1:250; phospho-Akt (Ser473) 1:50; phospho-STAT3 (Tyr705) 1:400; phospho-S6 (Ser235/236) 1:400; phospho-p44/42 MAPK (Erk1/2) (Thr202/Tyr204) 1:400; cleaved caspase-3 (Asp175) 1:400. The anti-Ki67 antibody was diluted 1:600 (Abcam).
Immunofluorescence
Stably transduced NIH-3T3 cells were grown on coverslips, fixed in 4% formaldehyde, washed in PBS, and incubated in blocking solution (5% goat serum and 0.1% Triton X-100 in PBS). After blocking, cells were incubated with an ALK monoclonal antibody (Cell Signaling Technology) diluted 1:1,000 in blocking buffer overnight at 4 °C. After washing the cells with 0.05% Tween 20 and PBS, cells were incubated with a secondary antibody (Life Technologies) diluted 1:500 in blocking buffer for 2 h at room temperature. After washing in PBS, slides were mounted with Prolong Gold Antifade Reagent with DAPI (Cell Signaling Technology) and imaged with a Leica TCS SP5 II confocal microscope. Immunofluorescence was independently performed twice and a representative experiment is shown in Fig. 2e.
Immunoblot
Cell lysates were prepared in RIPA buffer supplemented with proteinase/phosphatase inhibitor. Proteins were resolved in NuPAGE Novex 4–12% Bis-Tris Protein Gels (Life Technologies) and transferred electrophoretically onto a nitrocellulose 0.45 μm membrane (BioRad). Membranes were blocked for 1 h at room temperature in Odyssey Blocking Buffer (LI-COR) and were incubated overnight at 4 °C with the primary antibodies diluted at 1:1,000 in 50% Odyssey Blocking Buffer in PBS plus 0.1% Tween 20. The following primary antibodies were used (all from Cell Signaling Technologies unless stated otherwise): anti-α-tubulin (Sigma-Aldrich), anti-V5 (Thermo Scientific), anti-HA3F10 (Roche), phospho-ALK (Tyr1604), ALK, phospho-Akt (Ser473), Akt, phospho-STAT3 (Tyr705), STAT3, phospho-S6 (Ser235/236), S6, phospho-p44/42 MAPK (Erk1/2) (Thr202/Tyr204), p44/42 MAPK (Erk1/2), phospho-MEK1/2 (Ser221), MEK1/2, phospho-PRAS40 (Thr246), PRAS40 (D23C7), phospho-SHP-2 (Tyr580), SHP-2. After 4 washes of 5 min in PBS-T, membranes were incubated with secondary antibodies (IRDye 800CW goat anti-Rabbit, 1:20,000, LI-COR; IRDye 680RD goat anti-mouse, 1:20,000, LI-COR) in 50% Odyssey Blocking Buffer in PBS plus 0.1% Tween 20 for 45 min at room temperature. After 4 washes in PBS-T and a final wash with PBS, membranes were scanned with a LI-COR Odyssey CLx scanner and adjusted using LI-COR Image Studio. Immunoblots were independently performed at least twice and a representative experiment is shown in Figs 2b–d, 3b, 4b and Extended Data Figs 7a, 7d, 7f, 7h, 8c–e.
Luciferase reporter assay
The long terminal repeat in ALK intron 19 at the ATI site (LTR16B2, chr2:29,446,649–29,447,062; 414 bp) was amplified using genomic DNA from patient MM-15 and 5′-GTCCTCATGGCTCAGCTTGT-3′ and 5′-AGCACTACACAGGCCACTTC-3′ primers. The PCR product (chr2:29,446, 444–29,447,174; 731 bp) was cloned into pGL4.14-firefly luciferase vector (Promega). To determine the promoter activity of LTR16B2, 105 cells were transfected in triplicates with 500 ng pGL4.14-LTR16B2 or vector alone; as internal control, 200 ng pRL-TK-Renilla luciferase reporter vector (Promega) was co-transfected. Luciferase activity was measured using Dual-Glo Luciferase Assay System (Promega) 48 h after transfection. Promoter activity was calculated by normalizing firefly luciferase activity to the control Renilla luciferase activity and compared between pGL4.14-LTR16B2 and vector alone. The luciferase reporter assays were independently performed three times, the results were combined, and the mean ± s.d. is shown in Extended Data Fig. 6g.
Flow cytometry and fluorescence-activated cell sorting (FACS)
Flow cytometry analysis for in vitro transformation assays with Ba/F3 cells was performed on an LSRFortessa (BD Biosciences) at day 0 and day 14 after IL-3 withdrawal. GFP-or RFP-positive cells were sorted using the FITC (blue laser) or PE (yellow laser) channel, respectively, on a FACSAria II configured with 5 lasers (BD Biosciences).
In vitro transformation and drug treatment assays
Stably transduced Ba/F3 cells were cultured in RPMI medium supplemented with IL-3 (1 ng ml−1). For the cell proliferation assay, Ba/F3 cells were transferred into IL-3 depleted RPMI medium, and cell growth was quantified in quadruplicates every 2–4 days by a luminescence assay (Promega). For cell viability assays and ALK inhibitor–dose-response curves, 2,000 Ba/F3 cells were plated in triplicates in 96-well plates with increasing concentrations of the ALK inhibitors crizotinib (LC laboratories), TAE-684 (ChemieTek), or ceritinib (ChemieTek) as indicated. All drugs were re-suspended in DMSO. The cell viability was assessed after 72 h by a luminescence assay (Promega). Results were normalized to cell growth in medium containing an equivalent concentration of DMSO. The inhibition curve was determined with GraphPad Prism 6.0 software using the ‘log(inhibitor) vs response – variable slope’ nonlinear regression model. For immunoblots, 10 million Ba/F3 cells were harvested after 2 h treatment with crizotinib, washed in ice-cold PBS, and lysed in RIPA buffer. All assays were independently performed at least twice and a representative experiment is shown.
In vivo tumorigenicity and drug treatment assays
All animal experiments were performed in accordance with a protocol approved by MSKCC Institutional Animal Care and Use Committee (#11-12-029). The size for each cohort was determined based on previous experience without specific statistical methods. We re-suspended 106 cells of stably transfected NIH-3T3 or melan-a cells in 50 μl of 1:1 mix of PBS and Matrigel (BD Biosciences), and subcutaneously and bilaterally injected the cells into the flanks of 6–8 weeks old female CB17-SCID mice (Taconic). Mice were chosen randomly and no animals were excluded. For tumour growth assays, 5 mice were injected with parental or stably transduced cell lines and 10 tumours were assessed (expect of melan-a cells stably transfected with ALKF1174L, in which 4 mice were injected and 8 tumours were assessed). Tumour sizes were measured with callipers, without blinding, every 2 to 7 days for a period of up to 100 days, and were calculated using the following formula: tumour volume = (D ×d2)/2, whereby D and d refer to the long and short tumour diameter, respectively. For in vivo drug sensitivity studies, 9 mice were injected with the stably transduced NIH-3T3 cells expressing a luciferase reporter construct and the indicated plasmids. When the tumours reached an average size of 200–250 mm3, mice were randomized into a vehicle (4 mice) or treatment (5 mice) group. Mice were orally gavaged once a day with crizotinib (100 mg kg−1 per day) or vehicle. We performed non-blinded measurement of 8 tumours in the vehicle group and 10 tumours in the crizotinib group with callipers every 2 to 3 days, and growth curves were visualized with Prism GraphPad 6.0. In parallel, we monitored tumour growth by bioluminescence imaging of anaesthetized mice by retro-orbital injection of D-luciferin (150 mg per kg body weight) and imaging with the IVIS Spectrum Xenogen machine (Caliper Life Sciences). Bioluminescence analysis was performed using Living Image software, version 2.50. After euthanizing the mice, tumours were explanted and either lysed in RIPA buffer (Cell Signaling Technology) or fixed overnight in 4% paraformaldehyde, washed, embedded in paraffin, and sectioned for haematoxylin and eosin (H&E) staining or immunohistochemistry. Mice experiments were performed once.
Extended Data
Extended Data Figure 1. Comparison of the RNA-seq profiles of various ALK transcripts.

RNA-seq data are displayed in the Integrative Genomics Viewer (IGV). The grey bars/arrows indicate the sequencing reads. The blue lines connect sequencing reads that are aligned over the splice site of joining exons. a, The ALKATI transcript shows expression of ALK exons 20–29 and of ~ 400 bp in intron 19 (blue shaded area). No expression of exon 1–19 or intronic areas, other than in intron 19, are observed. The detailed view illustrates that the sequencing reads align continuously between exon 20 and intron 19 indicating uninterrupted transcription. The 5′-UTR of ALKATI (intron 19) and exon 20–29 are expressed at comparable levels. b, The full-length wild-type ALK transcript shows expression of all ALK exons and only very little expression of the introns. The detailed view displays that the sequencing reads align sharply to the exons, but not to the intron 19 region, which is present in ALKATI (blue shaded area). c, The ALK fusion transcript of a non-small cell lung cancer with an EML4–ALK translocation shows expression of ALK exons 20–29, and little expression of exons 1–19 and all introns. The detailed view illustrates that the transcription starts mainly at exon 20 due to a preserved splice site. Only few reads are aligned to the intron 19 region (blue shaded area). The green-labelled reads highlight chimaeric read pairs indicating the EML4–ALK translocation.
Extended Data Figure 2. Identification of the ALKATI transcript.

a, Northern blot of wild-type ALK-expressing neuroblastoma cell lines (SK-N-DZ and SK-N-BE2), EML4–ALK-expressing lung cancer cell lines (H3122, variant (V) 1 and H2228, variant (V) 3), ALKATI-expressing melanoma, one anaplastic thyroid carcinoma (ATC-28), and negative controls (melanoma cell lines). Except for the negative controls, each lane shows two bands: the lower B-band matches the shorter canonical (RefSeq) ALK transcript ending at ~ chr2:29,415,640; the upper A-band corresponds to a transcript with a 1.8 kb longer 3′-UTR ending at ~chr2:29,413,840. Two ALKATI-expressing melanomas, MM-284 and MM-74, show only weak signals because less than 1 μg RNA was available; for all other samples 5–10 μg RNA were used. See Supplementary Fig. 1 for uncropped blots. b, RNA-seq data displayed in IGV. The Sashimi plot illustrates the shorter B and the longer A ALK transcripts by the sharp drop of sequencing reads in the 3′-UTR at chr2:29,415,640 for the B and at chr2:29,413,840 for the A transcript. c, IGV view of the 5′-RACE-cDNA fragments obtained by massively parallel sequencing. More than 95% of the sequencing reads (grey arrows) start within the main ATI site of 25 bp (hg19 chr2:29,446,744–29,446,768). d, Sanger sequencing of the cloned 5′-RACE-cDNA fragments confirms the continuous transcription starting in ALK intron 19 and extending to exons 20 and 21. e, The ALKATI transcript consists of ~ 400 bp upstream of exon 20 and of ALK exons 20–29. The transcriptional initiation site was defined as the first base pair at which more than 5% of the transcripts were initiated (chr2:29,446,766). Other major transcription initiation sites are marked in red, the 5′- and 3′-UTRs in dark blue, the coding DNA sequence (CDS) in black, and the first and last base of each exon in light blue. The translation is initiated at 3 start codons (ATGs; bold and underlined): first ATG, hg19 chr2:29,446,360–29,446,362; second ATG, (+ 7–9); and third ATG (+ 61–3). f, The amino acid sequence of ALKATI. The translation is initiated at 1 of 3 start codons. The corresponding 3 methionines (bold and underlined) result in 3 different proteins, 61.08 kDa (552 amino acids), 60.82 kDa (550 amino acids), and 58.71 kDa (532 amino acids). The kinase domain is highlighted in red. The lysine in the ATP binding domain is marked bold and underlined, and was mutated to methionine (referring to wild-type ALK: p.K1150M) in the kinase-dead ALKATI-KD.
Extended Data Figure 3. RNApol II and H3K4me3 are enriched at the ATI site of ALKATI-expressing tumour samples.

a, b, ChIP–qPCR of H3K4me3 (a) and RNApol II (b) at the ATI site demonstrating enrichment of both marks in the ALKATI-expressing human tumour samples, but not in the negative controls, including a lung cancer cell line with EML4–ALK translocation (H3122) and a melanoma cell line (SKMEL-524). Error bars show mean ± s.e.m.; n = 3 technical replicates.
Extended Data Figure 4. ALKATI is transcribed from a genomically intact ALKlocus.
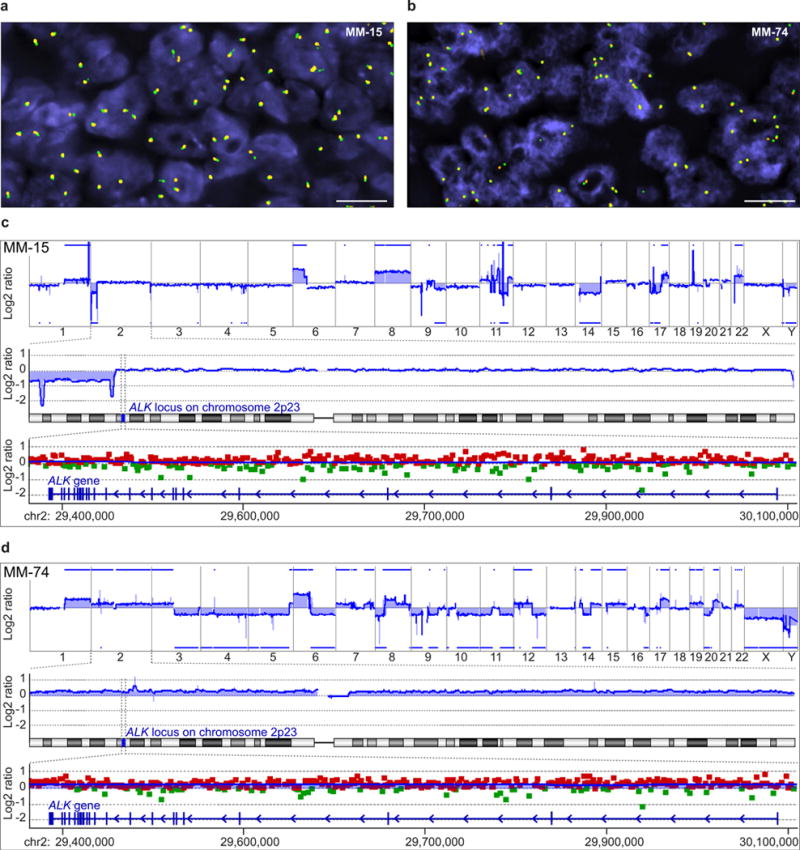
a, Interphase FISH with ALK flanking probes demonstrates juxtaposed green and orange signals indicating no ALK rearrangement in MM-15. Scale bar, 10 μm. b, Interphase FISH in MM-74 shows 3 green/orange fusion signals in the majority of nuclei indicating a trisomy 2, but no ALK rearrangement. Scale bar, 10 μm. c, The top panel shows the genome-wide array CGH profile of MM-15 with numerous chromosomal gains and losses across the entire genome. The chromosomes are aligned along the x axis. The blue line illustrates the relative copy number (log2 ratio) and the blue bars highlight copy number gains and losses. The middle panel illustrates the relative copy number (blue line) of chromosome 2. Distal to the ALK locus, a loss on the short (p) arm of chromosome 2 is indicated. The lower panel illustrates the relative copy number across the ALK locus. The red and green squares represent the log2 ratio of individual array CGH probes (green, positive log2 ratio; red, negative log2 ratio). No disruption or selective gains or losses are found at the ALK locus. d, The genome-wide array CGH profile of MM-74 shows numerous chromosomal gains and losses across the entire genome in the top panel. The middle panel displays a relative copy number gain of the entire chromosome 2, which is in line with the trisomy of chromosome 2 as indicated by FISH. The lower panel also displays trisomy of chromosome 2, but indicates no focal gains and losses at the ALK locus.
Extended Data Figure 5. Targeted sequencing and whole-genome sequencing reveals no recurrent genomic aberrations at the ALK locus.

a, Ultra-deep sequencing data of the ALK locus are displayed in IGV. The genomic region around intron 19 reveals several single nucleotide variations (SNVs). However, the vast majority of SNVs at the ALK locus are also found in the general population as they are detected in the pool of normal DNA, which was used as the control (pooled normal, bottom panel). Numerous SNVs are also documented in the Single Nucleotide Polymorphism database (dbSNP; http://www.ncbi.nlm.nih.gov/SNP/). No genomic aberrations were found at the transcription initiation site of ALKATI. Supplementary Table 2 shows the detected SNVs and indels at the ALK locus after filtering out SNPs documented in the dbSNP database. None of the genomic aberrations was found in more than one case, indicating that the expression of ALKATI is probably not caused by alterations of the DNA nucleotide sequence. b, c, Circos plots of the whole-genome sequencing data of MM-15 (b) and ATC-28 (c) illustrating numerous SNV and structural aberrations. Supplementary Table 3 lists the detected single nucleotide polymorphisms, and Supplementary Table 4 the detected structural aberrations. No recurrent genomic aberrations were found at the ALK locus.
Extended Data Figure 6. Local chromatin context at the alternative transcription initiation (ATI) site.

a, UCSC Genome Browser view of the ATI site. The RepeatMasker track shows transposable elements at the ATI region, including a long-terminal repeat (LTR) in intron 19 (LTR16B2) and a long interspersed element (LINE) in intron 18. The ENCODE tracks reveal a DNase I hypersensitivity cluster and H3K4me1 enrichment, but no H3K27ac enrichment. b, The methylation status of the ALK locus was assessed by custom capture of the ALK locus, followed by bisulfite treatment and next-generation sequencing. Bisulfite sequencing results of H3122 (top) and MM-15 (bottom) are displayed in the CG-bisulfite mode of IGV. The red colour denotes ‘C’ (cytosine) corresponding to methylated cytosine, which is preserved during the bisulphite reaction. The blue colour denotes ‘T’ (thymine) corresponding to unmethylated cytosine, which is converted to uracil in the bisulfite reaction, and subsequently amplified to thymine during PCR. c, Methylation level at CpG sites in ALKATI-expressing tumour samples (MM-15 and ATC-28) and non-ALKATI-expressing control cells (H3122, a lung cancer cell line with EML4–ALK expression and SKMEL-28, a melanoma cell line without ALKATI expression). d, Comparison of the methylation status of CpG sites adjacent to the ATI site in ALKATI-expressing tumour samples (MM-15 and ATC-28) and non-ALKATI-expressing control cells (H3122 and SKMEL-28). The regions flanking LTR16B2 have significantly lower CpG methylation levels in ALKATI-expressing samples than controls; red dots indicate a statistically significant difference (P < 0.05; Mann–Whitney test) between ALKATI-expressing and non-expressing samples. Black dots indicate no statistically significant difference. e, ChIP-seq profile of H3K27ac at the ALKATI locus. The 17 blue profiles were retrieved from ENCODE, the 5 red profiles are original data from our lab. Only the 3 melanoma samples (MM-15, SKMEL-28, and SKMEL-524; bottom), but not the 19 non-melanoma cell lines, show H3K27ac enrichment at the ATI site. f, ChIP–qPCR validation for the H3K27ac enrichment at the ATI site in 6 melanoma cell lines. Error bars show mean ± s.e.m.; n = 3 technical replicates. g, Luciferase reporter assay of LTR16B2 in melanoma cell lines (red) and lung cancer cell lines expressing EML4–ALK (green). Error bars show mean ± s.d.;n = 9 (3 biological replicates combined from 3 independent experiments).
Extended Data Figure 7. ALKATI is active in vitro, shows nuclear and cytoplasmic localization by immunohistochemistry, and induces tumorigenesis.

a, In vitro kinase assay. The indicated ALK variants were stably expressed in NIH-3T3 cells, immunoprecipitated, and assayed for tyrosine kinase activity. After the enzymatic reaction, the immunoprecipitated material was used for immunoblots to assess the amount of ALK protein used in the kinase assay. Error bars, mean ± s.d.; n = 4 technical replicates. b, Melanoma (MM-15) expressing ALKATI shows cytoplasmic and nuclear localization of ALK by immunohistochemistry. Melanocytic tumour expressing a TPM3–ALK translocation shows a cytoplasmic localization of the ALK fusion protein. Fibroblasts, epithelial cells, and reactive lymphocytes serve as internal negative controls. Scale bars, 100 μm. c, Flow cytometry analysis for green fluorescent protein (GFP) co-expressed from the same ALK-expression vector. Cells were cultured in IL-3-supplemented medium until day 0 (blue curve) and the number of GFP-positive cells was assessed. The number of GFP-positive ALK-expressing cells was assessed again 14 days after IL-3 withdrawal (red curve). d, Immunoblots of explanted NIH-3T3 tumour grafts expressing the indicated ALK isoforms. ALKATI was expressed at similar protein levels as in two ALKATI-expressing clinical human tumour samples. e, Growth curves of tumour grafts of melan-a cells stably expressing the indicated ALK isoforms in cohorts of 4–5 mice each with bilateral grafts. Error bars, mean ± s.e.m.; n = 8 tumours for ALKF1174L, n = 10 tumours for all other experimental groups; see also Source Data associated with this figure. f, Immunoblots of explanted melan-a tumour grafts expressing the indicated ALK variants compared to ALKATI-expressing human tumour samples. g, Flow cytometry analysis of the GFP signal in NIH-3T3 cells stably expressing low (ALKATI-low) or high levels of ALKATI (ALKATI-high) before grafting into SCID mice. h, Immunoblot of t-ALK in ALKATI-low and ALKATI-high cells, confirming differential expression of ALKATI. See Supplementary Fig. 1 for uncropped blots for a, d, f and h. i, Growth curvesof tumour grafts of ALKATI-low and ALKATI-high cells. Error bars, mean ± s.e.m.; n = 10 tumours; see also Source Data associated with this figure.
Extended Data Figure 8. Concentration-dependent ALK inhibition in ALKATI-, wild-type ALK-, ALKF1174L-, and EML4–ALK-expressing Ba/F3 cells.

a, b, Cell viability assay of Ba/F3 cells, either in the presence or absence of IL-3 (1 ng ml−1), expressing the indicated ALK isoforms and treated with the indicated doses of ALK inhibitors ceritinib (a) and TAE-684 (b). Cell viability was measured after 72 h of drug treatment. Error bars, mean ± s.e.m.; n = 3 biological replicates. c–e, Representative immunoblots of Ba/F3 cells stably expressing wild-type ALK (c), ALKF1174L (d), or EML4–ALK (e) and treated with increasing concentration of crizotinib for 2 h. See Supplementary Fig. 1 for uncropped blots.
Extended Data Figure 9. Expression of wild-type ALK, ALKF1174L, and EML4–ALK confers sensitivity to the ALK inhibitor crizotinib in vivo.

a–c, Bioluminescence of luciferase-labelled NIH-3T3 grafted tumours expressing wild-type ALK (a), ALKF1174L (b), or EML4–ALK (c) in SCID mice treated with either vehicle or crizotinib. Error bars, mean ± s.e.m.; n = 8 tumours; see also Source Data associated with this figure. d–f, H&E staining and immunohistochemistry of explanted tumours expressing wild-type ALK (d), ALKF1174L (e), or EML4–ALK (f) 48 h after the first crizotinib treatment. Scale bar, 50 μm. g, MSK-IMPACT assay reveals copy number alterations and loss of CDKN2A and PTEN in melanoma metastasis MM-382, but no mutations. The log2 ratio was calculated across all targeted regions by comparing the coverage in tumour versus normal. h, FISH for ALK shows no rearrangement; the 3 juxtaposed green/orange signals indicate a trisomy 2. Scale bar, 1 μm. i, The four FISH signals for MET and centromere 7 indicate a tetrasomy 7, but no MET amplification. Scale bar, 1μm.
Extended Data Table 1.
ALKATI-expressing tumours in the TCGA data set
| Type | ALKATI | Total # of cases | % |
|---|---|---|---|
| Skin cutaneous melanoma (SKCM) | 38 | 334 | 11.34 |
| Lung adenocarcinoma (LUAD) | 3 | 470 | 0.64 |
| Lung squamous cell carcinoma (LUSC) | 1 | 482 | 0.20 |
| Kidney renal clear cell carcinoma (KIRC) | 2 | 480 | 0.42 |
| Breast invasive carcinoma (BRCA) | 1 | 988 | 0.10 |
| Thyroid carcinoma (THCA) | 0 | 482 | 0.00 |
| Glioblastoma multiforme (GBM) | 0 | 153 | 0.00 |
| Brain lower grade glioma (LGG) | 0 | 271 | 0.00 |
| Bladder urothelial carcinoma (BLCA) | 0 | 182 | 0.00 |
| Prostate adenocarcinoma (PRAD) | 0 | 195 | 0.00 |
| Uterine corpus endometrial carcinoma (UCEC) | 0 | 118 | 0.00 |
| Kidney chromophobe (KICH) | 0 | 66 | 0.00 |
| Colorectal adenocarcinoma (COADREAD) | 0 | 316 | 0.00 |
| Ovarian carcinoma (OV) | 0 | 261 | 0.00 |
| Head and neck squamous cell carcinoma (HNSC) | 0 | 303 | 0.00 |
The frequency of ALKATI-expressing tumours in more than 5,000 tumour samples from 15 different cancer types in the TCGA RNA-seq data set.
Supplementary Material
Acknowledgments
We thank P. Romanienko for the northern blot; W. Pao for the EML4–ALK construct; L. Garraway for the 501Mel and WW94 cell lines; P. Koppikar for the Ba/F3 cells; and C. Sawyers, O. Abdel-Wahab, K. Griewank, and O. Guryanova for reviewing the manuscript. Next generation sequencing, array CGH and NanoString nCounter Assay were performed at the Center for Molecular Oncology, and interphase fluorescence in situ hybridization in the Molecular Cytogenetics Core at Memorial Sloan Kettering Cancer Center. This work was supported by grants from the Harry J. Lloyd Trust, the Jubiläumsfonds of the Oesterreichische Nationalbank (15461) and a Charles H. Revson Senior Fellowship to T.W.; the National Institutes of Health (NIH) grants DP2CA174499 and K08CA151660, and the Geoffrey Beene Cancer Research Fund to P.C.; the NIH grant K08CA140946, Alfred Bressler Scholars Endowment Fund and Gerstner Young Investigator Award to Y.C.; the NIH grant P50CA172012 to J. A. F.; the NIH grant P01CA12943 to M.L., M.F.B, L.W. and L.B.; and the NIH grant P30 CA008748 to Memorial Sloan Kettering Cancer Center (Core Grant).
Footnotes
Online Content Methods, along with any additional Extended Data display items and Source Data, are available in the online version of the paper; references unique to these sections appear only in the online paper.
Supplementary Information is available in the online version of the paper.
Author Contributions Experimental design: T.W., P.C. and Y.C. Sample collection: I.L., K.J.B., M.L., T.H., J.A.F., G.K.S., L.W., T.M. and R.M. 5′-RACE, array CGH, FISH and immunohistochemistry: T.W. Preparation of DNA and cDNA libraries and bisulfite sequencing: T.W. and S.N.S. Data analyses: T.W., W.L., M.B., R.S., A.S., N.L. and D.Z. NanoString: T.W. and L.B. Immunofluorescence: T.W. Western blots, and immunoprecipitation: T.W., Q.F.Z. and J.B. ChIP and ChIP-seq: L.R. and S.S. Generation of the expression vectors: T.W., Q.F.Z. and Z.C. Luciferase reporter assay: E.W.P.W. In vivo assays: T.W., A.C.O. and D.A.M. FACS: T.W. and W.H. In vitro kinase assay: T.W. and D.G. Review of histology and immunohistochemistry: T.W., K.B. and R.M. Patient data: M.A.P. and C.E.A. Manuscript writing: T.W., Y.C. and P.C. All authors reviewed and edited the manuscript.
Author Information The sequence of ALKATI has been deposited in the European Nucleotide Archive under the accession number LN864494. RNA-seq, ChIP-seq, DNA and bisulfite sequencing data have been deposited in the NCBI Sequence Read Archive with the accession number SRP058714. Readers are welcome to comment on the online version of the paper.
The authors declare no competing financial interests.
References
- 1.Kouzarides T. Chromatin modifications and their function. Cell. 2007;128:693–705. doi: 10.1016/j.cell.2007.02.005. [DOI] [PubMed] [Google Scholar]
- 2.Anders S, Reyes A, Huber W. Detecting differential usage of exons from RNA-seq data. Genome Res. 2012;22:2008–2017. doi: 10.1101/gr.133744.111. [DOI] [PMC free article] [PubMed] [Google Scholar]
- 3.GTEx Consortium. The Genotype-Tissue Expression (GTEx) project. Nature Genet. 2013;45:580–585. doi: 10.1038/ng.2653. [DOI] [PMC free article] [PubMed] [Google Scholar]
- 4.Reis PP, et al. mRNA transcript quantification in archival samples using multiplexed, color-coded probes. BMC Biotechnol. 2011;11:46. doi: 10.1186/1472-6750-11-46. [DOI] [PMC free article] [PubMed] [Google Scholar]
- 5.Northcott PA, et al. Enhancer hijacking activates GFI1 family oncogenes in medulloblastoma. Nature. 2014;511:428–434. doi: 10.1038/nature13379. [DOI] [PMC free article] [PubMed] [Google Scholar]
- 6.Xie M, et al. DNA hypomethylation within specific transposable element families associates with tissue-specific enhancer landscape. Nature Genet. 2013;45:836–841. doi: 10.1038/ng.2649. [DOI] [PMC free article] [PubMed] [Google Scholar]
- 7.Calo E, Wysocka J. Modification of enhancer chromatin: what, how, and why? Mol Cell. 2013;49:825–837. doi: 10.1016/j.molcel.2013.01.038. [DOI] [PMC free article] [PubMed] [Google Scholar]
- 8.Grant CE, Bailey TL, Noble WS. FIMO: scanning for occurrences of a given motif. Bioinformatics. 2011;27:1017–1018. doi: 10.1093/bioinformatics/btr064. [DOI] [PMC free article] [PubMed] [Google Scholar]
- 9.Soda M, et al. Identification of the transforming EML4–ALK fusion gene in non-small-cell lung cancer. Nature. 2007;448:561–566. doi: 10.1038/nature05945. [DOI] [PubMed] [Google Scholar]
- 10.Lemmon MA, Schlessinger J. Cell signaling by receptor tyrosine kinases. Cell. 2010;141:1117–1134. doi: 10.1016/j.cell.2010.06.011. [DOI] [PMC free article] [PubMed] [Google Scholar]
- 11.Bresler SC, et al. Differential inhibitor sensitivity of anaplastic lymphoma kinase variants found in neuroblastoma. Sci Transl Med. 2011;3:108ra114. doi: 10.1126/scitranslmed.3002950. [DOI] [PMC free article] [PubMed] [Google Scholar]
- 12.Mossé YP, et al. Identification of ALK as a major familial neuroblastoma predisposition gene. Nature. 2008;455:930–935. doi: 10.1038/nature07261. [DOI] [PMC free article] [PubMed] [Google Scholar]
- 13.Janoueix-Lerosey I, et al. Somatic and germline activating mutations of the ALK kinase receptor in neuroblastoma. Nature. 2008;455:967–970. doi: 10.1038/nature07398. [DOI] [PubMed] [Google Scholar]
- 14.Passoni L, et al. Mutation-independent anaplastic lymphoma kinase overexpression in poor prognosis neuroblastoma patients. Cancer Res. 2009;69:7338–7346. doi: 10.1158/0008-5472.CAN-08-4419. [DOI] [PubMed] [Google Scholar]
- 15.Montavon G, et al. Wild-type ALK and activating ALK-R1275Q and ALK-F1174L mutations upregulate Myc and initiate tumor formation in murine neural crest progenitor cells. Oncotarget. 2014;5:4452–4466. doi: 10.18632/oncotarget.2036. [DOI] [PMC free article] [PubMed] [Google Scholar]
- 16.Schulte JH, et al. High ALK receptor tyrosine kinase expression supersedes ALK mutation as a determining factor of an unfavorable phenotype in primary neuroblastoma. Clin Cancer Res. 2011;17:5082–5092. doi: 10.1158/1078-0432.CCR-10-2809. [DOI] [PubMed] [Google Scholar]
- 17.Cheng DT, et al. Memorial Sloan Kettering-Integrated Mutation Profiling of Actionable Cancer Targets (MSK-IMPACT): A hybridization capture-based next-generation sequencing clinical assay for solid tumor molecular oncology. J Mol Diagn. 2015;17:251–264. doi: 10.1016/j.jmoldx.2014.12.006. [DOI] [PMC free article] [PubMed] [Google Scholar]
- 18.Li H, et al. The sequence alignment/map format and SAMtools. Bioinformatics. 2009;25:2078–2079. doi: 10.1093/bioinformatics/btp352. [DOI] [PMC free article] [PubMed] [Google Scholar]
- 19.Trapnell C, Pachter L, Salzberg SL. TopHat: discovering splice junctions with RNA-Seq. Bioinformatics. 2009;25:1105–1111. doi: 10.1093/bioinformatics/btp120. [DOI] [PMC free article] [PubMed] [Google Scholar]
- 20.McKenna A, et al. The Genome Analysis Toolkit: a MapReduce framework for analyzing next-generation DNA sequencing data. Genome Res. 2010;20:1297–1303. doi: 10.1101/gr.107524.110. [DOI] [PMC free article] [PubMed] [Google Scholar]
- 21.Robinson JT, et al. Integrative genomics viewer. Nature Biotechnol. 2011;29:24–26. doi: 10.1038/nbt.1754. [DOI] [PMC free article] [PubMed] [Google Scholar]
- 22.Carbon S, et al. AmiGO: online access to ontology and annotation data. Bioinformatics. 2009;25:288–289. doi: 10.1093/bioinformatics/btn615. [DOI] [PMC free article] [PubMed] [Google Scholar]
- 23.Mathelier A, et al. JASPAR 2014: an extensively expanded and updated open-access database of transcription factor binding profiles. Nucleic Acids Res. 2014;42:D142–D147. doi: 10.1093/nar/gkt997. [DOI] [PMC free article] [PubMed] [Google Scholar]
- 24.Chi P, et al. ETV1 is a lineage survival factor that cooperates with KIT in gastrointestinal stromal tumours. Nature. 2010;467:849–853. doi: 10.1038/nature09409. [DOI] [PMC free article] [PubMed] [Google Scholar]
- 25.Zhang Y, et al. Model-based analysis of ChIP-Seq (MACS) Genome Biol. 2008;9:R137. doi: 10.1186/gb-2008-9-9-r137. [DOI] [PMC free article] [PubMed] [Google Scholar]
- 26.Won HH, Scott SN, Brannon AR, Shah RH, Berger MF. Detecting somatic genetic alterations in tumor specimens by exon capture and massively parallel sequencing. J Vis Exp. 2013:e50710. doi: 10.3791/50710. [DOI] [PMC free article] [PubMed] [Google Scholar]
- 27.Li H, Durbin R. Fast and accurate short read alignment with Burrows–Wheeler transform. Bioinformatics. 2009;25:1754–1760. doi: 10.1093/bioinformatics/btp324. [DOI] [PMC free article] [PubMed] [Google Scholar]
- 28.DePristo MA, et al. A framework for variation discovery and genotyping using next-generation DNA sequencing data. Nature Genet. 2011;43:491–498. doi: 10.1038/ng.806. [DOI] [PMC free article] [PubMed] [Google Scholar]
- 29.Cibulskis K, et al. Sensitive detection of somatic point mutations in impure and heterogeneous cancer samples. Nature Biotechnol. 2013;31:213–219. doi: 10.1038/nbt.2514. [DOI] [PMC free article] [PubMed] [Google Scholar]
- 30.Rausch T, et al. DELLY: structural variant discovery by integrated paired-end and split-read analysis. Bioinformatics. 2012;28:i333–i339. doi: 10.1093/bioinformatics/bts378. [DOI] [PMC free article] [PubMed] [Google Scholar]
- 31.Krueger F, Andrews SR. Bismark: a flexible aligner and methylation caller for Bisulfite-Seq applications. Bioinformatics. 2011;27:1571–1572. doi: 10.1093/bioinformatics/btr167. [DOI] [PMC free article] [PubMed] [Google Scholar]
- 32.Boeva V, et al. Control-free calling of copy number alterations in deep-sequencing data using GC-content normalization. Bioinformatics. 2011;27:268–269. doi: 10.1093/bioinformatics/btq635. [DOI] [PMC free article] [PubMed] [Google Scholar]
- 33.Wang J, et al. CREST maps somatic structural variation in cancer genomes with base-pair resolution. Nature Methods. 2011;8:652–654. doi: 10.1038/nmeth.1628. [DOI] [PMC free article] [PubMed] [Google Scholar]
- 34.McLaren W, et al. Deriving the consequences of genomic variants with the Ensembl API and SNP Effect Predictor. Bioinformatics. 2010;26:2069–2070. doi: 10.1093/bioinformatics/btq330. [DOI] [PMC free article] [PubMed] [Google Scholar]
- 35.Krzywinski M, et al. Circos: an information aesthetic for comparative genomics. Genome Res. 2009;19:1639–1645. doi: 10.1101/gr.092759.109. [DOI] [PMC free article] [PubMed] [Google Scholar]
- 36.Geiss GK, et al. Direct multiplexed measurement of gene expression with color-coded probe pairs. Nature Biotechnol. 2008;26:317–325. doi: 10.1038/nbt1385. [DOI] [PubMed] [Google Scholar]
- 37.Bennett DC, Cooper PJ, Hart IR. A line of non-tumorigenic mouse melanocytes, syngeneic with the B16 melanoma and requiring a tumour promoter for growth. Int J Cancer. 1987;39:414–418. doi: 10.1002/ijc.2910390324. [DOI] [PubMed] [Google Scholar]
- 38.Refaeli Y, Van Parijs L, Alexander SI, Abbas AK. Interferon gamma is required for activation-induced death of T lymphocytes. J Exp Med. 2002;196:999–1005. doi: 10.1084/jem.20020666. [DOI] [PMC free article] [PubMed] [Google Scholar]
- 39.Ponomarev V, et al. A novel triple-modality reporter gene for whole-body fluorescent, bioluminescent, and nuclear noninvasive imaging. Eur J Nucl Med Mol Imaging. 2004;31:740–751. doi: 10.1007/s00259-003-1441-5. [DOI] [PubMed] [Google Scholar]
Associated Data
This section collects any data citations, data availability statements, or supplementary materials included in this article.