


Fig. 8.
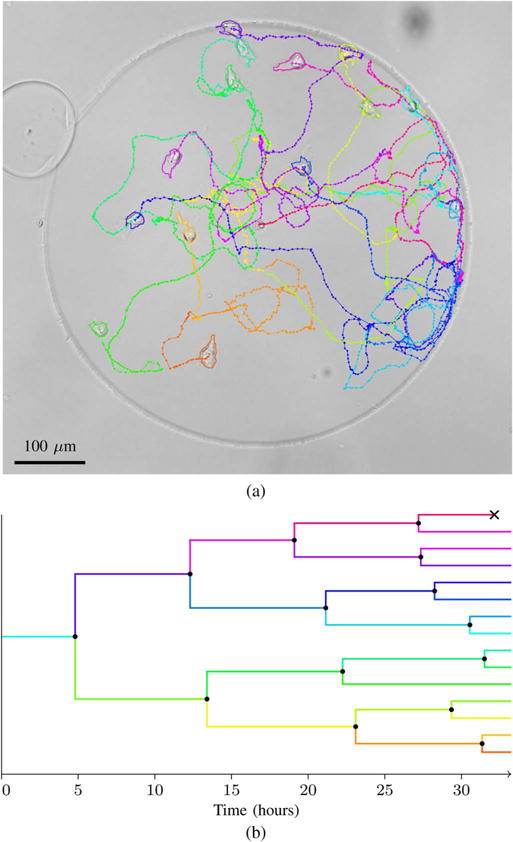
Representative tracking result from the MuSC dataset. Image (a) shows the tracks and the outlines at the end of the image sequence, overlayed on the last image of the sequence. The same image is shown without annotation in Fig. 6, and the entire image sequence can be viewed with annotation in Supplemental Video 1. Plot (b) shows the lineage tree corresponding to the tracks. Mitotic events are shown as black dots and apoptotic events are shown as black crosses.