


Fig. 3.
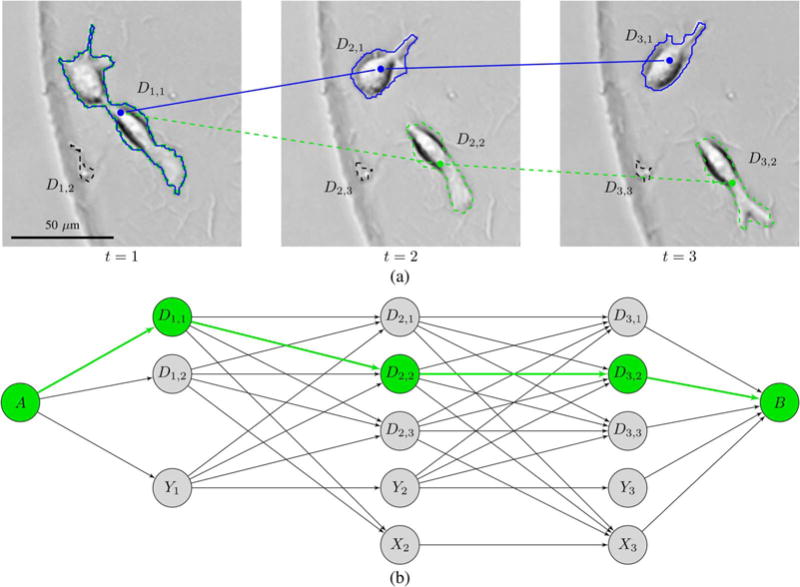
State space diagram (b) for the addition of a track to an image sequence with 3 images (a). There is a preexisting track shown in blue, and the state space diagram describes all the possible ways to add a second track. The roles of the nodes and the arcs between them are explained in Section IV-B. The arrows that go out of the “born later” states Y1, Y2, and Y3 represent both mitosis arcs and arcs for migration into the field of view. Arrows that go into the “dead” states X2 and X3 represent both apoptosis arcs and arcs for migration out of the field of view. Note that there is no X1 state, as we do not include cells in the tracking if they are dead in the first image. To avoid cluttering the state space diagram, we have set τmax to 1 so that only migrations between detections in adjacent images appear in the trellis. Even though this is a very small example with only three images and τmax = 1, there are 42 different paths through the state space diagram, assuming that only the maximum utility arcs between pairs of nodes are included in the trellis, so that each arrow represents a single arc. The path going through the three “born later” states represents the option of not adding a second track at all, but all of the other paths represent different ways in which a second track can be added. The correct way to add a second track, as sharing D1,1 with the blue track and then passing through D2,2 and D3,2 is shown as a green dashed track through the image sequence and a corresponding green path through the state space diagram.