


Figure 3. Time-lapse life cell imaging of CPT-treated SKOV3 cells.
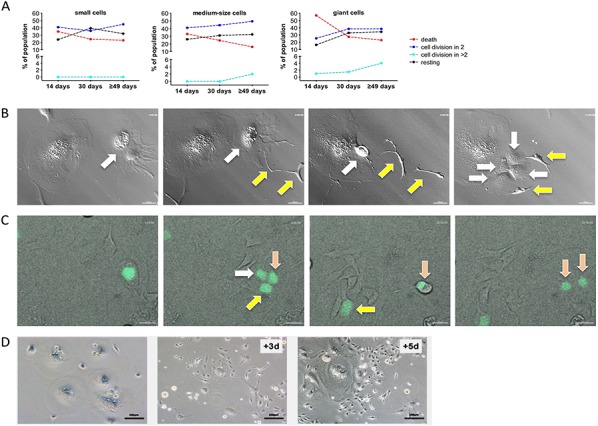
A. Quantitation of cell fate on day 14, on day 30 and on day ≥49 of CPT treatment for small, medium and giant cells. Cells were observed for 70 hours by life cell imaging and grouped as indicated. Statistical analysis was performed by Chi-squared test. B. Images from Video S2 showing the budding of two cells (yellow arrows) from a giant cell (white arrow) followed by multi-daughter division of the giant cell into four daughter cells (white arrows). C. Images from Video S3 showing division of a giant cell into three daughter cells (white, yellow and pink arrows) followed by regular mitosis of one of the daughter cells (pink arrows). H2B-GFP expressing giant cells on day 14 of CPT treatment were enriched by filtering and plated on a layer of CPT-treated unlabeled feeder cells. D. Clonal out growth of small cells from giant cells. The images show an area initially occupied by giants cells (left-most image) and the same area 3 days and 5 days later.