


Figure 2. p53 and Fascin correlate with colorectal cancer cell migration in vitro.
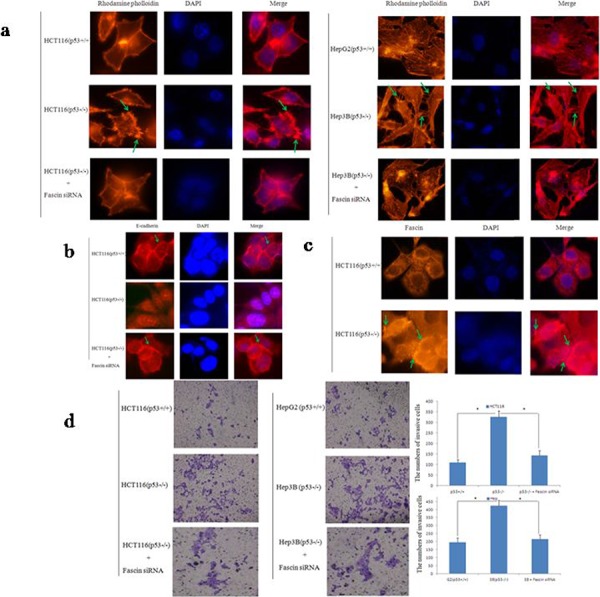
a. Cell morphology and cytoskeleton analysis by immunofluorescence microscopy. Green stars indicate filopodia. The experiments were performed in triplicate. b. Representative images of E-cadherin expression in HCT116 cells. Photos were taken under × 400 magnification. Green stars indicate Fascin wxpression. The experiments were performed in triplicate. c. Representative images of Fascin expression in HCT116 cells. Photos were taken under × 400 magnification. Green stars indicate Fascin wxpression. The experiments were performed in triplicate. d. Transwell invasion assay by the 24-transwell system and quantitative analysis. The pictures were taken 24 h after seeding (original magnification: × 100). The numbers of invasive cells were counted in five representative high power fields per transwell. Three independent experiments were carried out in triplicate.