


Figure 4. Pathways Altered in Melanoma.
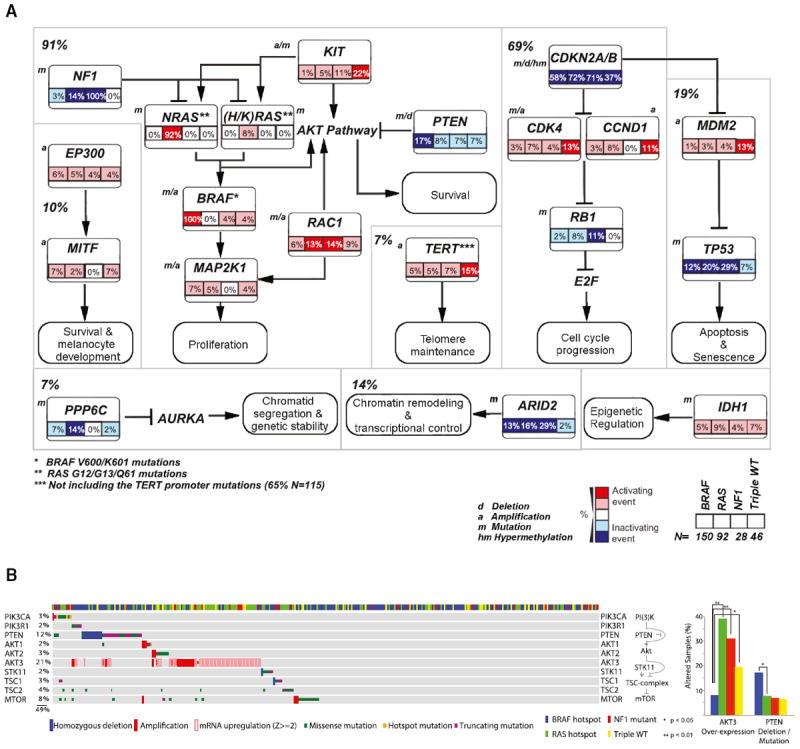
(A) Percentage of recurrently altered pathways in the four melanoma subtypes (BRAF = V600/K601 mutants, RAS [N/H/K] = G12, G13, and Q61 mutants) through integration of mutation, copy-number variation, and hypermethylation data are indicated (n = 316; not shown are one hyper-mutated and one co-occurring BRAF/NRAS hot-spot mutant sample). Manual curated pathway shows percentage of TP53, CDKN2A/RB1, and MAPK/AKT pathway across all samples (note: percentages of alterations of MAPK and AKT pathway are combined, given their high level of interconnectivity). a, amplification; d, deletion, m, mutation.
(B) Co-occurring somatic CNAs, mutations, and mRNA expression (color code indicated on graph) for the PI(3)K/mTOR pathway across the four mutation subtypes (left). Bar graph indicating percentage of fraction of subtypes with AKT3 activation or PTEN inactivation (right). Enrichment of a given alteration in a subgroup is estimated by Fisher’s exact test.
See also Figure S4.