


Figure 2.
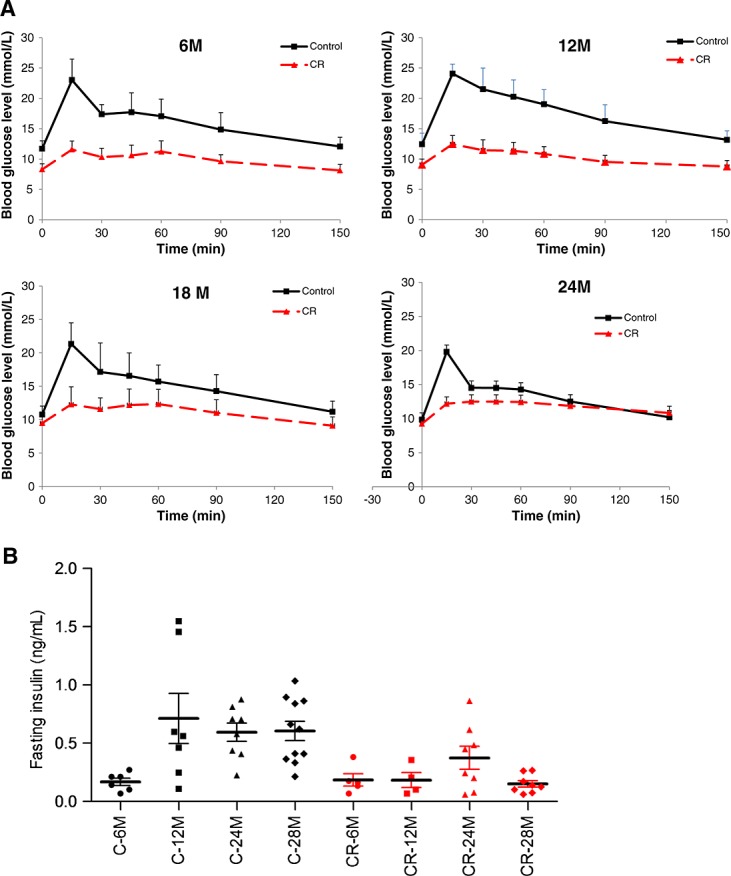
Measurements of insulin sensitivity. (A) The results of the oral glucose tolerance test of mice of different ages on caloric-restricted (CR) diet or control diet. Mice were subjected to an oral glucose tolerance test 2 weeks prior to sacrifice. Data represent mean ± standard deviation. Mixed models: difference on diet: overall and in all age groups P < 0.001. Difference on age: overall and in the control group: 12 vs. 6, 18, or 24 months P < 0.001. In control group, all age groups are compared with each other P < 0.03. (B) Insulin levels of the same mice at the different ages on caloric-restricted diet or control diet. Mixed models: difference on diet: overall and in all age groups P < 0.001. Difference on age: overall no significances. In control group: 6 vs. 12 P < 0.09, 24 P = 0.055, or 28 months P = 0.052.