


Figure 2.
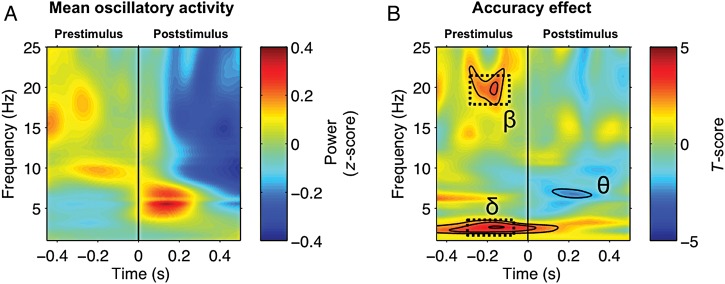
Time–frequency analysis of pre- to poststimulus MEG activity and accuracy effects. (A) Mean oscillatory activity of responses to target tones in auditory sensors (selected individually, see Materials and methods). Time is expressed relative to target onset (black vertical line). (B) Accuracy effect (correct minus incorrect stimulus) on oscillatory activity. Effect is expressed in t-scores; contours indicate significance thresholds of P < 0.05, 0.01, and 0.001 for those clusters that survived the correction for multiple comparisons (see Materials and methods and Maris and Oostenveld 2007). Black dashed boxes highlight prestimulus (−300 to −100 ms) Accuracy effects in delta (1–3 Hz) and beta (18–22 Hz) power, corresponding to a stronger increase in these 2 frequency bands for targets that are subsequently correctly perceived.