



Abstract
Diffuse spread through brain parenchyma and the presence of hypoxic foci rimmed by neoplastic cells are two cardinal features of glioblastoma, and low oxygen is thought to drive movement of malignant gliomas in the core of the lesions. Transcription factors associated with epithelial‐to‐mesenchymal transition (EMT) have been linked to this invasion, and we found that hypoxia increased in vitro invasion up to fourfold in glioblastoma neurosphere lines and induced the expression of ZEB1. Immunohistochemical assessment of 295 surgical specimens consisting of various types of pediatric and adult brain cancers showed that ZEB1 expression was significantly higher in infiltrative lesions than less invasive tumors such as pilocytic astrocytoma and ependymoma. ZEB1 protein was also present in human fetal periventricular stem and progenitor cells and ZEB1 inhibition impaired migration of in vitro propagated human neural stem cells. The induction of ZEB1 protein in hypoxic glioblastoma neurospheres could be partially blocked by the HIF1alpha inhibitor digoxin. Targeting ZEB1 blocked hypoxia‐augmented invasion of glioblastoma cells in addition to slowing them in normoxia. These data support the role for ZEB1 in invasive and high‐grade brain tumors and suggest its key role in promoting invasion in the hypoxic tumor core as well as in the periphery.
Keywords: glioma, hypoxia, neural stem cell, ZEB1, EMT
Introduction
Glioblastoma (GBM) is the most frequently occurring malignant primary brain tumor in adults. Despite some advances in diagnosis, surgical resection, radiation and chemotherapy, most patients still die within 1–2 years of diagnosis 18, 51, 53. This poor prognosis is thought to be largely caused by the invasive pattern of tumour growth, which precludes complete resection, and resistance to standard therapies in the remaining glioma cells. Hypoxia has been postulated as a main driver of invasion in numerous cancer types 28, 39, 40, and hypoxic pseudopalisades represent a cardinal feature in the neuropathological classification of GBM 31. Interestingly, pseudopalisades in GBMs contain highly migratory cells 6, and the hypoxic niche has been hypothesized to represent a main stimulus for local glioma cell dispersion 21. Stem‐like properties associated with therapeutic resistance are also induced in glioma cells by low oxygen in these regions 3, 22, 29.
A number of prior reports have documented a role for hypoxia and hypoxia inducible factors (HIFs) 1α and 2α in promoting movement of glioma cells using experimental models 9, 13, 35, 47, 62, and begun to elucidate the downstream factors that may mediate this effect 13, 20, 41, 44, 59. However, one set of transcription factors known to help drive hypoxia‐induced invasion of tumors arising outside the brain—those associated with epithelial to mesenchymal transition (EMT)—has not been extensively studied in the context of GBM motility in hypoxia. EMT involves loss of cell–cell contact and increased digestion of extracellular matrix boundaries in both normal development and disease 4, 25, 55. Astrocytic tumors arise from neuroepithelial progenitors, which differ significantly from classical epithelial layers with respect to their adhesion to a basement membrane and the presence of tight interactions between cells. To avoid confusion with mesenchymal transformation of epithelial cells, the term glial to mesenchymal transformation (GMT) was recently introduced to describe EMT‐like features in neoplastic glial cells 33.
In this study, we focus on the role of the transcription factor ZEB1 in brain tumor pathogenesis, particularly the hypoxic induction of invasion. ZEB1 is an E‐box binding protein that has been implicated in the regulation of cell cycle progression, as well as the establishment of a motile and drug‐resistant tumor phenotype 19. Many tumor types including gliomas exhibit drug resistance are thought to be mediated by ZEB1 43, 49. ZEB1 has an inverse correlation with microRNA‐200c levels in some tumors, and this ZEB/miR‐200‐loop can control the differentiation status of cells, linking this EMT factor with cancer stem cell phenotype 5, 27, 48. The tumor suppressor p53 also regulates stem cell status and mesenchymal induction in cancer cells mediated through modulation of the ZEB1/miR‐200c‐loop 8. ZEB1 has also been shown to be regulated by WNT/β‐catenin, another prominent stem cell pathway in various cancer types including GBM 23, 42. Additional pathways linked to ZEB1 in tumors outside the brain include the tumor suppressor Rb 1 and TGF‐β 15.
While ZEB1 is considered to be one of the key regulators of EMT, tumor cell dissemination and the emergence of therapeutic resistance, relatively little is known about its role in gliomas or other brain tumor types 23, 49, and a link to hypoxia has not been explored in this context. We find that protein levels of ZEB1 are increased in higher grade and more invasive brain tumors, and that its hypoxic induction in GBM is required for the invasive properties associated with low oxygen levels. We further identify ZEB1 expression in human fetal neural stem/progenitor cell compartments and show its ability to regulate human fetal neurosphere motility, suggesting that it may play a role in the migration of immature non‐neoplastic cells during brain development.
Material and Methods
Cell culture, hypoxic and digoxin treatment
The GBM neurosphere (gliomasphere) lines HSR‐GBM1 (GBM1) and 040622 (622) were generously provided by Dr Angelo Vescovi (Milan, Italy), and the pediatric glioma cell line KNS42 54 was obtained from the Japan Cancer Research Resources Cell Bank. Both were cultured in serum‐free media as neurospheres as previously described 23. Their identity was confirmed by analysis of nine tandem repeats plus a gender‐determining marker, Amelogenin using the StemElite kit (Promega, http://www.promega.com/) in the John Hopkins Core Facility for DNA fragment analyses (http://grcf.med.jhu.edu/) as part of their standard STR fingerprinting service for cell lines. The polymerase chain reaction (PCR) product was electrophoresed on an ABI Prism® 3730xl Genetic Analyzer using the Internal Lane Standard 600 (Promega). Data were analyzed using GeneMapper v 4.0 software (Applied Biosystems, http://www.appliedbiosystems.com). The profiles of the used cell material are attached in Supporting Information Table S2.
Human fetal neural stem and progenitor cells (NSCs) were obtained from first trimester human fetal autopsy specimens in concordance with German law and Ethics Board evaluation (University Medical Center Freiburg, Germany) and cultured as neurospheres as previously described 30. The study was also approved by the Johns Hopkins Institutional Review Board. The pancreatic cancer cell line PANC1 was a gift from William Matsui from The Sidney Kimmel Comprehensive Cancer, Johns Hopkins Hospital, Baltimore, MD, USA.
Hypoxic growth (1% O2, 5% CO2 and 94% N2) was maintained in a special chamber (COY laboratory equipment, Grass Lake, MI, USA). For all analyses, it was ensured that cells resided in exponential growth phase. Digoxin (Baxter, Deerfield, IL, USA) was applied in a working concentration of 100 nM dissolved in Dulbecco's modified Eagle's medium (DMSO) (Sigma‐Aldrich, St. Louis, MO, USA) for 24 h. Selection for resistance against the antibiotic puromycin [short hairpin RNAs (shRNAs)] was achieved at a concentration of 2 μg/mL (for tumor cultures) and 0.2 μg/mL (for fetal NCSs) in standard growth culture media.
mRNA and protein analyses
The abundance of mRNA was assessed by conversion into complementary DNA and subsequent quantitative real‐time PCR measurements using SYBR green‐based fluorescence (Bio‐Rad, Hercules, CA, USA). To ensure purity of RNA, on‐column genomic DNA digestion was applied prior to transcription into RNA. Relative quantification to housekeeping gene β‐ACTIN was assessed with ddCt‐method. Primer sequences can be found in Supporting Information Table S1. Western blotting was performed as described before 34; antibodies were used as per the manufacturer's instructions (Supporting Information Table S1).
DNA constructs and viral infection
We used the following lentiviral constructs: pLKO.1 scramble shRNA (Addgene plasmid 1864) 45, and ZEB1 I shRNA and ZEB1 V shRNA (both from The RNA Consortium, Broad Institute, Clone ID TRCN0000017563 and TRCN0000017567). Lentiviral particles were produced by transfecting 293T cells with VSVG envelope plasmid, delta 8.9 gag/pol plasmid and the plasmid of interest, as described previously 23 using Lipofectamine2000 (Life Technologies, http://www.lifetechnologies.com) as per the manufacturer's instructions. After 24 h, the medium was changed to FGF/EGF neurosphere media [DMEM and F12 from Life Technologies, hEGF and b‐FGF from Peprotech, http://www.peprotech.com, Heparin from Sigma‐Aldrich 23 ] and supernatants were collected at 48 and 72 h. These supernatants were pooled, passed through a 0.45‐μm filter, concentrated using polyethylene glycol and then frozen at −80°C until needed.
Immunohistochemistry
Tissue microarrays (TMAs) were constructed using tumor samples obtained from 1977 to 2009. These as well as normal tissues from autopsy specimens were retrieved from the archives of the Johns Hopkins Hospital Department of Pathology following institutional review board approval. TMAs were constructed and sectioned using standard procedures at the Johns Hopkins TMA core facility. For each tumor, four cores measuring 0.6 mm in diameter were included per array. ZEB1 staining was performed using sodium citrate (pH = 6) antigen retrieval, anti‐ZEB1‐antibody incubation overnight, anti‐rabbit antibody detection using biotinylated secondary‐antibody (Vectastain, #PK6101) and 3,3′‐diaminobenzidine (DAB)‐based stain. A pancreatic cell line (PANC1) cell block was used as a positive control, while negative controls included omission of primary antibody and the analysis of multiple non‐neoplastic control tissues included on the TMAs 56. A neuropathologist (CGE) blinded to diagnosis scored average ZEB1 staining intensity in tumor nuclei as negative (0), weak (1), moderate (2) or strong (3). The average percent of cell staining rounded to the nearest decile (ie, 0%, 10%, 20%) was also scored for each tumor. These two scores were then multiplied to generate Z‐scores between 0 and 300.
I n vitro invasion assay
Invasion of GBM‐derived cells was analyzed using the modified Boyden Chamber assay. A 24‐well system was used with each well containing a permeable Transwell insert (Becton Dickinson Biosciences, https://www.bdbiosciences.com/) with 8‐μm pores. To mimic three‐dimensional extracellular environment and to investigate infiltrative potential of the cells, the inserts were coated with growth factor reduced Matrigel (Becton Dickinson Biosciences) and incubated for 1 h at 37°C. Subsequently, cells suspended in 500 μL of DMEM were placed on top of each insert membrane. The bottom was filled with 700 μL of DMEM media containing 10% fetal calf serum (FCS). For GBM1, 75 000 cells, for KNS42, 25 000 cells, and for the fetal NSCs, 15 000 cells were used for the assays.
All Boyden chamber assays were analyzed 14 h after exposure to hypoxia or normoxia. The upper side of the membrane was then wiped carefully with a cotton swab to remove the rest of the plated cells. The membrane was then fixed in ice‐cold 90% ethanol for 25 minutes and stained with hematoxylin. The migration/invasion of the GBM cells was evaluated by counting the cell nuclei on the lower side of the membrane under light microscope and 20× magnification (4–6 view fields).
Statistical analyses
Significance was tested with two‐sided Student's t‐test performed in Statistica v5.1. (Statsoft, Tulsa, OK, USA). The Mann–Whitney test was used for immunohistochemical analyses. Bar plots present the mean and standard error of the mean.
Results
Increased ZEB1 protein in higher grade and more invasive brain tumors
We screened a range of pediatric and adult brain tumors for ZEB1 expression in order to determine if this protein was associated with a particular grade or type of neoplasm. These included relatively compact tumors such as World Health Organization (WHO) grade I pilocytic astrocytoma (PA, n = 65) and WHO grades I to III ependymoma (EP, n = 71), as well as infiltrating lesions including WHO grade II diffuse astrocytoma (A, n = 15), WHO grade III anaplastic astrocytoma (AA, n = 16), pediatric (n = 32) and adult (n = 61) WHO grade IV glioblastoma (pGBM and aGBM), WHO grade II oligodendroglioma (O, n = 14) and medulloblastoma (MB, n = 21). ZEB1 immunostaining was almost entirely nuclear, and varied in intensity and percentage of neoplastic cell stained. Almost no staining was noted in entrapped non‐neoplastic neuronal or glial elements within tumor specimens. Among adult and pediatric GBM represented on the tissue microarray, both extremely cellular regions presumable from the tumor core and less cellular ones most likely from the periphery could show high levels of ZEB1 protein.
Representative images from multiple tumor types with varying expression levels are shown in Figure 1A–H, and mean expression for all groups of lesions is depicted in Figure 1I. ZEB1 expression was significantly higher in infiltrating astrocytic, oligodendroglial and embryonal brain tumors as compared to the more compact ependymoma and pilocytic astrocytoma (Figure 1J, P < 0.0001). Within the infiltrative group, low‐grade (WHO grade II) tumors had significantly lower amounts of ZEB1 as compared to high‐grade (WHO grade III and grade IV) tumors (Figure 1K, P < 0.0001). Finally, pediatric GBM had significantly higher ZEB1 protein levels than adult GBM (P < 0.002).
Figure 1.
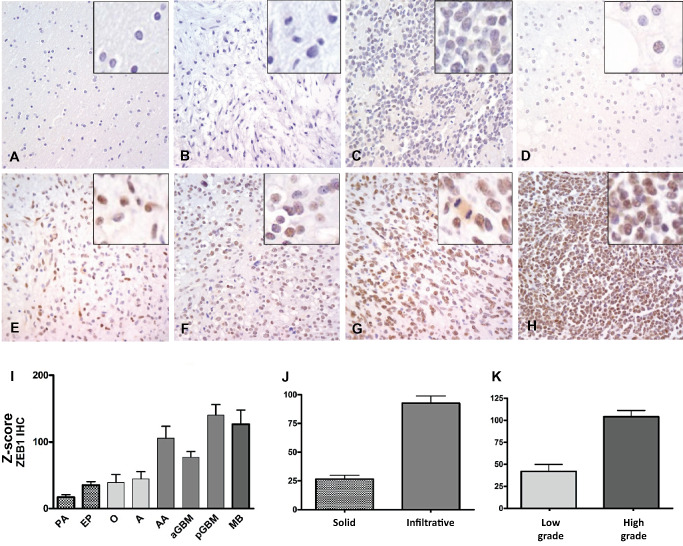
Immunohistochemical analysis of ZEB1 expression in brain tumors: ZEB1 protein was not detected in normal adult brain (A), with varying levels of nuclear staining in pilocytic astrocytoma (“PA”) (B), ependymoma (“EP”) (C), oligodendroglioma (“O”) (D), astrocytoma (“A”) (E), anaplastic astrocytoma (“AA”), adult GBM (“aGBM”) (F), pediatric GBM (“pGBM”) (G) and medulloblastoma (“MB”) (H). Analysis of tissue microarrays facilitated analysis of multiple cases from each group (I). Relatively solid tumors (pilocytic astrocytoma and ependymoma) had significantly lower levels of ZEB1 than infiltrative ones (J). Among infiltrating gliomas, Grade II tumors showed significantly lower ZEB1 expression than high‐grade ones (K) (original magnification 400× for A–H).
Hypoxia increases invasion of glioma cultures and expression of EMT factors
To test the effect of reduced oxygen on glioma cell dispersion, we compared the ability of adult GBM1 cells and the pediatric GBM line KNS42, both grown in serum‐free media as neurospheres, to invade when cultured in 1% or 21% oxygen. In both the adult and the pediatric GBM lines, we observed a significant increase in invasive behavior over 14 h in hypoxic cells, with a two‐ to fourfold increase in the number of hypoxic cells moving through pores in a modified Boyden chamber assay as compared to normoxic cells (P < 0.001, Figure 2A). Representative light‐field images of GBM1 cells, which have traversed the membrane under normoxia and hypoxia, are shown in the lower panels of Figure 2A.
Figure 2.
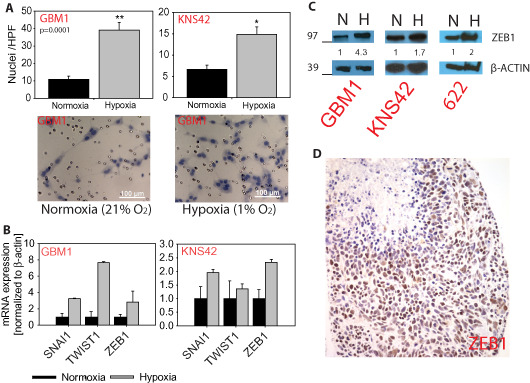
Hypoxia augmented invasion and activates ZEB1 in GBM‐derived neurospheres: Boyden chamber‐based cellular invasion is increased up to fourfold, representative light‐field microscope pictures of hematoxylin‐stained cells traversed the membrane in the two oxygen tension conditions (20× magnification) (A). Hypoxia increases expression of GMT activators ZEB1 and TWIST1 and SNAI1 (B + C). Strongly ZEB1‐positive cells in the cellular GBM core including a necrotic area (D, original magnification 400×). *P ≤ 0.05, **P ≤ 0.0001.
Next, we aimed to identify possible molecular effectors of the hypoxia‐augmented motile behavior of glioma neurospheres. Hypoxia resulted in elevated mRNA expression of the three tested EMT‐associated transcription factors (TWIST1, SNAI1 and ZEB1; Figure 2B) compared with normoxic conditions. These transcription factors are known to play key roles in dissemination of many types of cancer 4, 50 including GBMs 24, but their roles in hypoxia are not known in glial tumors. Because relatively little is known about the functional role of ZEB1 in gliomas, and given its association with infiltrating and higher grade brain tumors, we focused our further investigations on that transcription factor. Western blot analysis confirmed that GBM cells grown in 1% oxygen contain higher levels of ZEB1 protein compared with normoxic ones (Figure 2C). A histopathological hallmark of GBM is the presence of pseudopalisades around hypoxic and necrotic cores, and it has been suggested that these hypoxic cells are particularly motile 6. Interestingly, ZEB1 staining was prominent in these regions of hypoxia in GBM (Figure 2D).
Inhibition of HIF1α can reduce expression of ZEB1 under hypoxia
Hypothesizing that the classical hypoxic response drives the expression of ZEB1 in our glioma models, we tested if pharmacological reduction of a core regulator of hypoxia, HIF‐1alpha (HIF1α), affects the ZEB1 levels. The cardiac glycoside digoxin has been shown to lower HIF1α levels in cancer 60, including glioma neurospheres 3. We confirmed that Digoxin treatment caused robust reduction of HIF1α protein in hypoxic GBM1 cells (Figure 3A). Consistent with the notion that HIF1α regulates ZEB1, we observed a marked decrease in ZEB1 expression following digoxin treatment in the GBM neurospheres (Figure 3B). Digoxin‐mediated reduction of HIF1α and ZEB1 also resulted in impairment of in vitro GBM1 invasion under hypoxia (Figure 3C).
Figure 3.
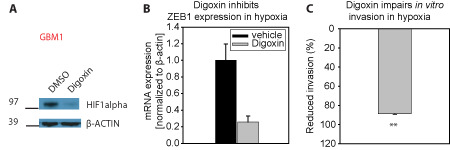
Targeting HIF1a inhibits ZEB1 and invasion: Digoxin‐mediated inhibition of HIF1a in GBM cells grown in hypoxia (A) shows inhibition of ZEB1 (B) accompanied with significant reduction of in vitro invasion (C). **P ≤ 0.0001.
ZEB1 knockdown inhibits invasion in both normoxia and hypoxia
Prior reports have implicated ZEB1 in the invasion of glioma cells in the normoxic periphery of tumors 49. To directly examine the role of ZEB1 in GBM invasion in the hypoxic core of tumors as well, we tested the effects of targeted ZEB1 knockdown in vitro. We identified two shRNA species able to reduce ZEB1 protein levels in glioma neurospheres by 63%–100% as quantified using NIH ImageJ following lentiviral delivery compared with scrambled control (Figure 4). This decrease in ZEB1 levels had a profound effect on the invasive capacity of glioma cells, with a significant reduction in the number of tumor cells extending through pores in Transwell assays under both normoxic and hypoxic conditions. Similar effects were observed following ZEB1 knockdown in the pediatric GBM line KNS42 (Figure 4). These data suggest that ZEB1 is an important factor promoting invasion in both normoxia and hypoxia.
Figure 4.
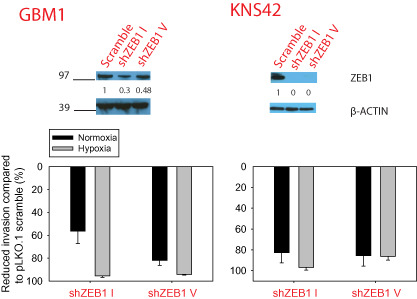
Direct ZEB1 targeting inhibits invasion: shRNA‐mediated knockdown of ZEB1 as quantified by integrated pixel densitometry (A) resulted in significant reduced in vitro invasion in both oxygen conditions, the suppression was more prominent under hypoxia though and the hypoxia‐mediated induction of invasion was not detectable any longer (B).
ZEB1 is expressed in human fetal stem and progenitor cells and promotes their migration
Many brain tumors are thought to arise from neural stem and progenitor cells, and we found particularly high ZEB1 expression levels in pediatric brain tumors. In fetal brain development, the majority of stem cells are found around the ventricles in a “ventricular zone,” with more differentiated progenitors forming a dense germinal matrix then migrating outward to generate neurons and astrocytes. We stained three fetal human brains from the late first trimester or early second trimester for ZEB1, and saw moderate to strong expression in the cells nearest the ventricles (Figure 5A, red arrowheads), as well as moderate expression in many of the neural progenitors deeper in the germinal matrix (Figure 5A, black arrowheads). Scattered cells in the developing fetal deep gray matter structures, white matter and cortical ribbon also expressed ZEB1, but these were less frequent and often showed weaker staining than those in the periventricular zones.
Figure 5.
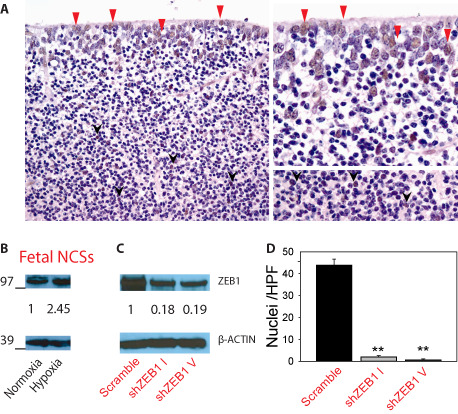
ZEB1 activation in fetal stem and progenitor cells and ZEB1‐dependent motility: ZEB1‐positive cells in the neural stem cell niche of the human fetal subventricular zone (red arrowheads) as well as in lower layer of the germinal matrix (black arrow heads) (A), human fetal neural stem cells induce ZEB1 under hypoxia (B) and shRNA‐mediated ZEB1 inhibition significantly impaired their migration capacity. **P ≤ 0.0001.
We were also able to detect ZEB1 protein in human neural stem and progenitor cells isolated from the brain of first trimester fetuses and grown as neurospheres. Exposure to low oxygen increased the level of ZEB1 proteins in a manner similar to that seen in GBM neurospheres, suggesting that this EMT‐associated transcription factor may also respond to physiological hypoxia during normal development (Figure 5B). Growth in hypoxia resulted in a non‐significant increase in cellular invasion of those human fetal neurospheres compared with normoxic cells in Boyden chamber assays (data not shown). We were able to reduce ZEB1 protein expression in fetal NCSs by over 80% using two shRNAs (Figure 5C), and this significantly inhibited the invasion in normoxia (Figure 5D). We were not able to assess invasive capacity of the neurospheres in hypoxia because of the limited availability of cells following ZEB1 knockdown. Nevertheless, these studies support the concept that the EMT regulator ZEB1 promotes human NCS motility.
Further support for the expression of ZEB1 in neural stem cells and migrating progenitors comes from analysis of the publicly available Allen Brain Atlas database (http://www.brain‐map.org/). Their in situ hybridization studies in the developing mouse brain show highest ZEB1 abundance in neurogenic regions around the ventricles, in cerebellar progenitors and in the rostral migratory stream (Supporting Information Figure S1A). Moreover, Affymetrix chip‐based mRNA expression analyses of human brains revealed its highest expression in very young fetal samples (weeks 8–9), as highlighted by the red signature in the heat map shown in Supporting Information Figure S1B.
Discussion
Tumor spread accounts for the majority of the cancer‐associated deaths 4 and is increasingly thought to be modulated by the local microenvironment. A key microenvironmental factor in malignant gliomas is the presence of hypoxic regions, which have been associated with both increased motility and the promotion of stemness both in normal and in neoplastic conditions 2, 26, 29, 37. Transcription factors originally linked to EMT in normal development are also increasingly being implicated in both tumor spread and stemness in a range of cancers, including GBM, and some have begun to refer to “GMT” in these glial tumors 4, 33, 55. In this study, we investigated the role of EMT factors, particularly ZEB1, in promoting invasion of hypoxic cells.
Using pediatric and adult GBM lines grown in serum‐free conditions as neurospheres, we found that hypoxia strongly promotes a more invasive phenotype in vitro. Previous investigators had also reported that hypoxic exposure augments glioma cell motility; however, this earlier work was generally carried out using classical high serum growth conditions, which are thought to alter the cellular phenotype 13, 14, 44. Prior molecular analyses, most of which also used high serum adherent glioma cell lines, have identified a range of factors that may promote glioma invasion in hypoxia. These include the tumor necrosis factor‐alpha (TNF‐α) processing metallopeptidase ADAM17 52, 61, the hormone receptor CXCR7 12, carbonic anhydrase IV and other metabolic enzymes involved in the regulation of pH 41, as well as carboxypeptidase E 17, 20. Our work now adds ZEB1 to this list.
The role of EMT factors in glioma pathogenesis is receiving increasing attention. SNAI1 and TWIST1, two main transcriptional activators of the EMT response, have been broadly implicated in glioma progression by a number of groups 11, 16, 36, 46. We found both to be induced by hypoxia in GBM neurospheres, which is consistent with the reports in other cellular contexts indicating that they can be HIF targets 32, 57. We also identified upregulation of a third EMT transcription factor, ZEB1, at both the mRNA and the protein levels when glioma cells were grown in hypoxia. Blocking HIF translation using digoxin reduced both invasive capacity and ZEB1 expression in glioma neurospheres, indicating that ZEB1 can be regulated by core hypoxic signaling pathways in some gliomas. Relatively little is known about the role of ZEB1 in gliomas, and we therefore focused our additional studies on this transcription factor.
ZEB1 appears to play a critical role in the invasive behavior of hypoxic glioma cells. When we directly suppressed ZEB1 expression using two distinct shRNA, we were able to dramatically reduce invasion in both pediatric and adult GBM lines. Glioma invasion under normoxic conditions was also strongly inhibited, consistent with the fact that we identified relatively abundant ZEB1 protein in GBM neurospheres grown in 21% oxygen. One of us recently investigated the role of ZEB1 in mediating tumor spread in the normoxic periphery of GBMs 49, and we now extend its role to hypoxia‐driven invasion in high‐grade glial tumors.
Given the potentially broad importance of ZEB1 in both normoxic and hypoxic tumor regions, we surveyed expression of the protein in a range of pediatric and adult central nervous system (CNS) neoplasms. Consistent with a role in tumor invasion, we found higher levels of ZEB1 in invasive gliomas and medulloblastoma as compared to less infiltrative tumors such as pilocytic astrocytoma and ependymoma. Within the group of infiltrating astrocytoma and oligodendroglioma, high‐grade (WHO grades III and IV) tumors had significantly more ZEB1 expression than low‐grade (WHO grade II) ones. Among GBM, pediatric tumors had particularly high levels of ZEB1.
We also identified nuclear ZEB1 protein in many human periventricular neural stem and progenitor cells, as well as in cerebellar stem and progenitor cells, a distribution similar to that previously observed in rodents 10, 58. Thus, the high ZEB1 expression seen in many gliomas and embryonal tumors may relate to origins from, or similarity to, neural stem cell compartments. Indeed, ZEB1‐mediated EMT has previously been associated with cancer stem cell populations in different tumor types outside the brain 4, 7. Recent studies have also linked ZEB1 to WNT signaling, mesenchymal phenotype and worse outcomes in malignant gliomas 24, 38, 49. In support of the concept that ZEB1 plays an important role in non‐neoplastic neural stem cell behavior, two shRNA targeting ZEB1 in human fetal neural progenitors significantly reduced their invasive properties in vitro.
Our study thus documents the expression of ZEB1 in a wide range of brain tumors, particularly high‐grade and invasive lesions, as well as human neural stem and progenitor cells in migratory zones. We find that a hypoxic local microenvironment can stimulate both ZEB1 expression and tumor invasion, while ZEB1 knockdown slows down tumor spread in both hypoxia and normoxia. In addition to providing general support for the functional importance of “GMT” factors, our data suggest that targeting HIF factors or key downstream mediators such as ZEB1 represents a new way to curb glioma spread.
Supporting information
Figure S1. In situ hybridization studies show ZEB1 expression predominantly occur in neurogenic active regions (subventricular zone, cerebellum) and particular strong in prenatal mouse development [©2012 Allen Institute for Brain Science. Late stage parental mouse brain does not show any ZEB1 staining, Allen Developing Mouse Brain Atlas (Internet). Available from: http://developingmouse.brain‐map.org.] (A); strong ZEB1 activation in very early human embryonic development [up to week 9 after last menstrual period, postconceptional week (PCA)] as assed via micro array expression profiling [©2012 Allen Institute for Brain Science. BrainSpan Atlas of the Developing Human Brain (Internet). Available from: http://brainspan.org/] (B).
Table S1. List of antibodies incl. dilutions and primers for qPCR used in this study.
Table S2. Cell line identification profiles of the used in vitro material assessed with short tandem repeat (STR) assay (fetal neural stem cells = fNCS).
Acknowledgments
UDK was supported by the Dr Mildred‐Scheel post‐doctoral fellowship from the Deutsche Krebshilfe. AKS was supported by the Friedrich‐Ebert Stiftung. EHR is a St. Baldricks fellow. The Strategic Research Fund (SFF) and Research Commission of Heinrich‐Heine University Düsseldorf supports the work of JM. This work was funded in part by NIH fund (R01NS055089) to CGE.
Conflict of interest
The authors declare that they have no conflict of interest.
References
- 1. Arima Y, Hayashi H, Sasaki M, Hosonaga M, Goto TM, Chiyoda T et al (2012) Induction of ZEB proteins by inactivation of RB protein is key determinant of mesenchymal phenotype of breast cancer. J Biol Chem 287:7896–7906. [DOI] [PMC free article] [PubMed] [Google Scholar]
- 2. Bar EE (2011) Glioblastoma, cancer stem cells and hypoxia. Brain Pathol 21:119–129. [DOI] [PMC free article] [PubMed] [Google Scholar]
- 3. Bar EE, Lin A, Mahairaki V, Matsui W, Eberhart CG (2010) Hypoxia increases the expression of stem‐cell markers and promotes clonogenicity in glioblastoma neurospheres. Am J Pathol 177:1491–1502. [DOI] [PMC free article] [PubMed] [Google Scholar]
- 4. Brabletz T (2012) To differentiate or not—routes towards metastasis. Nat Rev Cancer 12:425–436. [DOI] [PubMed] [Google Scholar]
- 5. Brabletz T, Jung A, Spaderna S, Hlubek F, Kirchner T (2005) Opinion: migrating cancer stem cells—an integrated concept of malignant tumour progression. Nat Rev Cancer 5:744–749. [DOI] [PubMed] [Google Scholar]
- 6. Brat DJ, Castellano‐Sanchez AA, Hunter SB, Pecot M, Cohen C, Hammond EH et al (2004) Pseudopalisades in glioblastoma are hypoxic, express extracellular matrix proteases, and are formed by an actively migrating cell population. Cancer Res 64:920–927. [DOI] [PubMed] [Google Scholar]
- 7. Chaffer CL, Marjanovic ND, Lee T, Bell G, Kleer CG, Reinhardt F et al (2013) Poised chromatin at the ZEB1 promoter enables breast cancer cell plasticity and enhances tumorigenicity. Cell 154:61–74. [DOI] [PMC free article] [PubMed] [Google Scholar]
- 8. Chang C‐J, Chao C‐H, Xia W, Yang J‐Y, Xiong Y, Li CW et al (2011) p53 regulates epithelial‐mesenchymal transition and stem cell properties through modulating miRNAs. Nat Cell Biol 13:317–323. [DOI] [PMC free article] [PubMed] [Google Scholar]
- 9. Chen L, Han L, Zhang K, Shi Z, Zhang J, Zhang A et al (2012) VHL regulates the effects of miR‐23b on glioma survival and invasion via suppression of HIF‐1α/VEGF and β‐catenin/Tcf‐4 signaling. Neuro‐Oncol 14:1026–1036. [DOI] [PMC free article] [PubMed] [Google Scholar]
- 10. Darling DS, Stearman RP, Qi Y, Qiu MS, Feller JP (2003) Expression of Zfhep/deltaEF1 protein in palate, neural progenitors, and differentiated neurons. Gene Expr Patterns 3:709–717. [DOI] [PMC free article] [PubMed] [Google Scholar]
- 11. Elias MC, Tozer KR, Silber JR, Mikheeva S, Deng M, Morrison RS et al (2005) TWIST is expressed in human gliomas and promotes invasion. Neoplasia 7:824–837. [DOI] [PMC free article] [PubMed] [Google Scholar]
- 12. Esencay M, Sarfraz Y, Zagzag D (2013) CXCR7 is induced by hypoxia and mediates glioma cell migration towards SDF‐1α. BMC Cancer 13:347. [DOI] [PMC free article] [PubMed] [Google Scholar]
- 13. Fujiwara S, Nakagawa K, Harada H, Nagato S, Furukawa K, Teraoka M et al (2007) Silencing hypoxia‐inducible factor‐1alpha inhibits cell migration and invasion under hypoxic environment in malignant gliomas. Int J Oncol 30:793–802. [PubMed] [Google Scholar]
- 14. Gessler F, Voss V, Dützmann S, Seifert V, Gerlach R, Kögel D (2010) Inhibition of tissue factor/protease‐activated receptor‐2 signaling limits proliferation, migration and invasion of malignant glioma cells. Neuroscience 165:1312–1322. [DOI] [PubMed] [Google Scholar]
- 15. Gregory PA, Bracken CP, Smith E, Bert AG, Wright JA, Roslan S et al (2011) An autocrine TGF‐beta/ZEB/miR‐200 signaling network regulates establishment and maintenance of epithelial‐mesenchymal transition. Mol Biol Cell 22:1686–1698. [DOI] [PMC free article] [PubMed] [Google Scholar]
- 16. Han S‐P, Kim J‐H, Han M‐E, Sim H‐E, Kim K‐S, Yoon S et al (2011) Snai1 is involved in the proliferation and migration of glioblastoma cells. Cell Mol Neurobiol 31:489–496. [DOI] [PMC free article] [PubMed] [Google Scholar]
- 17. Hatzikirou H, Basanta D, Simon M, Schaller K, Deutsch A (2012) “Go or grow”: the key to the emergence of invasion in tumour progression? Math Med Biol 29:49–65. [DOI] [PubMed] [Google Scholar]
- 18. Hegi ME, Diserens A‐C, Gorlia T, Hamou M‐F, de Tribolet N, Weller M et al (2005) MGMT gene silencing and benefit from temozolomide in glioblastoma. N Engl J Med 352:997–1003. [DOI] [PubMed] [Google Scholar]
- 19. Hill L, Browne G, Tulchinsky E (2013) ZEB/miR‐200 feedback loop: at the crossroads of signal transduction in cancer. Int J Cancer 132:745–754. [DOI] [PubMed] [Google Scholar]
- 20. Höring E, Harter PN, Seznec J, Schittenhelm J, Bühring H‐J, Bhattacharyya S et al (2012) The “go or grow” potential of gliomas is linked to the neuropeptide processing enzyme carboxypeptidase e and mediated by metabolic stress. Acta Neuropathol (Berl) 124:83–97. [DOI] [PubMed] [Google Scholar]
- 21. Jensen RL (2009) Brain tumor hypoxia: tumorigenesis, angiogenesis, imaging, pseudoprogression, and as a therapeutic target. J Neurooncol 92:317–335. [DOI] [PubMed] [Google Scholar]
- 22. Kahlert UD, Maciaczyk D, Dai F, Claus R, Firat E, Doostkam S et al (2012) Resistance to hypoxia‐induced, BNIP3‐mediated cell death contributes to an increase in a CD133‐positive cell population in human glioblastomas in vitro . J Neuropathol Exp Neurol 71:1086–1099. [DOI] [PubMed] [Google Scholar]
- 23. Kahlert UD, Maciaczyk D, Doostkam S, Orr BA, Simons B, Bogiel T et al (2012) Activation of canonical WNT/β‐catenin signaling enhances in vitro motility of glioblastoma cells by activation of ZEB1 and other activators of epithelial‐to‐mesenchymal transition. Cancer Lett 325:42–53. [DOI] [PubMed] [Google Scholar]
- 24. Kahlert UD, Nikkhah G, Maciaczyk J (2013) Epithelial‐to‐mesenchymal(‐like) transition as a relevant molecular event in malignant gliomas. Cancer Lett 331:131–138. [DOI] [PubMed] [Google Scholar]
- 25. Kalluri R, Weinberg RA (2009) The basics of epithelial‐mesenchymal transition. J Clin Invest 119:1420–1428. [DOI] [PMC free article] [PubMed] [Google Scholar]
- 26. Keith B, Simon MC (2007) Hypoxia‐inducible factors, stem cells, and cancer. Cell 129:465–472. [DOI] [PMC free article] [PubMed] [Google Scholar]
- 27. Korpal M, Lee ES, Hu G, Kang Y (2008) The miR‐200 family inhibits epithelial‐mesenchymal transition and cancer cell migration by direct targeting of E‐cadherin transcriptional repressors ZEB1 and ZEB2. J Biol Chem 283:14910–14914. [DOI] [PMC free article] [PubMed] [Google Scholar]
- 28. Krishnamachary B, Berg‐Dixon S, Kelly B, Agani F, Feldser D, Ferreira G et al (2003) Regulation of colon carcinoma cell invasion by hypoxia‐inducible factor 1. Cancer Res 63:1138–1143. [PubMed] [Google Scholar]
- 29. Li Z, Bao S, Wu Q, Wang H, Eyler C, Sathornsumetee S et al (2009) Hypoxia‐inducible factors regulate tumorigenic capacity of glioma stem cells. Cancer Cell 15:501–513. [DOI] [PMC free article] [PubMed] [Google Scholar]
- 30. Lopez WOC, Nikkhah G, Kahlert UD, Maciaczyk D, Bogiel T, Moellers S et al (2013) Clinical neurotransplantation protocol for Huntington's and Parkinson's disease. Restor Neurol Neurosci 31:579–595. [DOI] [PubMed] [Google Scholar]
- 31. Louis DN, Ohgaki H, Wiestler OD, Cavenee WK, Burger PC, Jouvet A et al (2007) The 2007 WHO classification of tumours of the central nervous system. Acta Neuropathol (Berl) 114:97–109. [DOI] [PMC free article] [PubMed] [Google Scholar]
- 32. Luo D, Wang J, Li J, Post M (2011) Mouse snail is a target gene for HIF. Mol Cancer Res 9:234–245. [DOI] [PubMed] [Google Scholar]
- 33. Mahabir R, Tanino M, Elmansuri A, Wang L, Kimura T, Kimura T et al (2014) Sustained elevation of Snail promotes glial‐mesenchymal transition after irradiation in malignant glioma. Neuro‐Oncol 16:671–685. [DOI] [PMC free article] [PubMed] [Google Scholar]
- 34. Mao X, Hütt‐Cabezas M, Orr BA, Weingart M, Taylor I, Rajan AK et al (2013) LIN28a facilitates the transformation of human neural stem cells and promotes glioblastoma tumorigenesis through a pro‐invasive genetic program. Oncotarget 4:1050–1064. [DOI] [PMC free article] [PubMed] [Google Scholar]
- 35. Méndez O, Zavadil J, Esencay M, Lukyanov Y, Santovasi D, Wang SC et al (2010) Knock down of HIF‐1alpha in glioma cells reduces migration in vitro and invasion in vivo and impairs their ability to form tumor spheres. Mol Cancer 9:133. [DOI] [PMC free article] [PubMed] [Google Scholar]
- 36. Mikheeva SA, Mikheev AM, Petit A, Beyer R, Oxford RG, Khorasani L et al (2010) TWIST1 promotes invasion through mesenchymal change in human glioblastoma. Mol Cancer 9:194. [DOI] [PMC free article] [PubMed] [Google Scholar]
- 37. Mohyeldin A, Garzón‐Muvdi T, Quiñones‐Hinojosa A (2010) Oxygen in stem cell biology: a critical component of the stem cell niche. Cell Stem Cell 7:150–161. [DOI] [PubMed] [Google Scholar]
- 38. Nagaishi M, Paulus W, Brokinkel B, Vital A, Tanaka Y, Nakazato Y et al (2012) Transcriptional factors for epithelial‐mesenchymal transition are associated with mesenchymal differentiation in gliosarcoma. Brain Pathol 22:670–676. [DOI] [PMC free article] [PubMed] [Google Scholar]
- 39. Pàez‐Ribes M, Allen E, Hudock J, Takeda T, Okuyama H, Viñals F et al (2009) Antiangiogenic therapy elicits malignant progression of tumors to increased local invasion and distant metastasis. Cancer Cell 15:220–231. [DOI] [PMC free article] [PubMed] [Google Scholar]
- 40. Pennacchietti S, Michieli P, Galluzzo M, Mazzone M, Giordano S, Comoglio PM (2003) Hypoxia promotes invasive growth by transcriptional activation of the met protooncogene. Cancer Cell 3:347–361. [DOI] [PubMed] [Google Scholar]
- 41. Proescholdt MA, Merrill MJ, Stoerr E‐M, Lohmeier A, Pohl F, Brawanski A (2012) Function of carbonic anhydrase IX in glioblastoma multiforme. Neuro‐Oncol 14:1357–1366. [DOI] [PMC free article] [PubMed] [Google Scholar]
- 42. Sánchez‐Tilló E, de Barrios O, Siles L, Cuatrecasas M, Castells A, Postigo A (2011) β‐catenin/TCF4 complex induces the epithelial‐to‐mesenchymal transition (EMT)‐activator ZEB1 to regulate tumor invasiveness. Proc Natl Acad Sci U S A 108:19204–19209. [DOI] [PMC free article] [PubMed] [Google Scholar]
- 43. Sánchez‐Tilló E, Fanlo L, Siles L, Montes‐Moreno S, Moros A, Chiva‐Blanch G et al (2014) The EMT activator ZEB1 promotes tumor growth and determines differential response to chemotherapy in mantle cell lymphoma. Cell Death Differ 21:247–257. [DOI] [PMC free article] [PubMed] [Google Scholar]
- 44. Ali MA, Reis A, Ding LH, Story MD, Habib AA, Chattopadhyay A, Saha D (2009) SNS‐032 prevents hypoxia‐mediated glioblastoma cell invasion by inhibiting hypoxia inducible factor‐1α expression. Int J Oncol 34:1051–1060. [DOI] [PubMed] [Google Scholar]
- 45. Sarbassov DD, Guertin DA, Ali SM, Sabatini DM (2005) Phosphorylation and regulation of Akt/PKB by the rictor‐mTOR complex. Science 307:1098–1101. [DOI] [PubMed] [Google Scholar]
- 46. Savary K, Caglayan D, Caja L, Tzavlaki K, Bin Nayeem S, Bergström T et al (2013) Snail depletes the tumorigenic potential of glioblastoma. Oncogene 32:5409–5420. [DOI] [PMC free article] [PubMed] [Google Scholar]
- 47. Shen SH, Kwan AL, Chen YY, Wang ZX (2013) Effect of silencing HIF‐1α on proliferation, invasion and migration of glioblastoma U87 cells. Neurol Sci 34:365–371. [DOI] [PubMed] [Google Scholar]
- 48. Shimono Y, Zabala M, Cho RW, Lobo N, Dalerba P, Qian D et al (2009) Downregulation of miRNA‐200c links breast cancer stem cells with normal stem cells. Cell 138:592–603. [DOI] [PMC free article] [PubMed] [Google Scholar]
- 49. Siebzehnrubl FA, Silver DJ, Tugertimur B, Deleyrolle LP, Siebzehnrubl D, Sarkisian MR et al (2013) The ZEB1 pathway links glioblastoma initiation, invasion and chemoresistance. EMBO Mol Med 5:1196–1212. [DOI] [PMC free article] [PubMed] [Google Scholar]
- 50. Spaderna S, Schmalhofer O, Wahlbuhl M, Dimmler A, Bauer K, Hlubek F et al (2008) The transcriptional repressor ZEB1 promotes metastasis and loss of cell polarity in cancer. Cancer Res 68:537–544. [DOI] [PubMed] [Google Scholar]
- 51. Stupp R, Mason WP, van den Bent MJ, Weller M, Fisher B, Taphoorn MJ et al (2005) Radiotherapy plus concomitant and adjuvant temozolomide for glioblastoma. N Engl J Med 352:987–996. [DOI] [PubMed] [Google Scholar]
- 52. Szalad A, Katakowski M, Zheng X, Jiang F, Chopp M (2009) Transcription factor Sp1 induces ADAM17 and contributes to tumor cell invasiveness under hypoxia. J Exp Clin Cancer Res 28:129. [DOI] [PMC free article] [PubMed] [Google Scholar]
- 53. Tabatabai G, Stupp R, van den Bent MJ, Hegi ME, Tonn JC, Wick W, Weller M (2010) Molecular diagnostics of gliomas: the clinical perspective. Acta Neuropathol (Berl) 120:585–592. [DOI] [PubMed] [Google Scholar]
- 54. Takeshita I, Takaki T, Kuramitsu M, Nagasaka S, Machi T, Ogawa H et al (1987) Characteristics of an established human glioma cell line, KNS‐42. Neurol Med Chir (Tokyo) 27:581–587. [DOI] [PubMed] [Google Scholar]
- 55. Thiery JP, Acloque H, Huang RYJ, Nieto MA (2009) Epithelial‐mesenchymal transitions in development and disease. Cell 139:871–890. [DOI] [PubMed] [Google Scholar]
- 56. Wellner U, Schubert J, Burk UC, Schmalhofer O, Zhu F, Sonntag A et al (2009) The EMT‐activator ZEB1 promotes tumorigenicity by repressing stemness‐inhibiting micrornas. Nat Cell Biol 11:1487–1495. [DOI] [PubMed] [Google Scholar]
- 57. Yang M‐H, Wu M‐Z, Chiou S‐H, Chen P‐M, Chang S‐Y, Liu CJ et al (2008) Direct regulation of TWIST by HIF‐1alpha promotes metastasis. Nat Cell Biol 10:295–305. [DOI] [PubMed] [Google Scholar]
- 58. Yen G, Croci A, Dowling A, Zhang S, Zoeller RT, Darling DS (2001) Developmental and functional evidence of a role for Zfhep in neural cell development. Brain Res Mol Brain Res 96:59–67. [DOI] [PubMed] [Google Scholar]
- 59. Zagzag D, Lukyanov Y, Lan L, Ali MA, Esencay M, Mendez O et al (2006) Hypoxia‐inducible factor 1 and VEGF upregulate CXCR4 in glioblastoma: implications for angiogenesis and glioma cell invasion. Lab Invest 86:1221–1232. [DOI] [PubMed] [Google Scholar]
- 60. Zhang H, Qian DZ, Tan YS, Lee K, Gao P, Ren YR et al (2008) Digoxin and other cardiac glycosides inhibit HIF‐1alpha synthesis and block tumor growth. Proc Natl Acad Sci U S A 105:19579–19586. [DOI] [PMC free article] [PubMed] [Google Scholar]
- 61. Zheng X, Jiang F, Katakowski M, Kalkanis SN, Hong X, Zhang X et al (2007) Inhibition of ADAM17 reduces hypoxia‐induced brain tumor cell invasiveness. Cancer Sci 98:674–684. [DOI] [PMC free article] [PubMed] [Google Scholar]
- 62. Zhou X, Liu Z, Shi Q, Jiao J, Bian W, Song X et al (2013) Geranylgeranyltransferase I regulates HIF‐1α promoting glioblastoma cell migration and invasion. J Neurooncol 112:365–374. [DOI] [PubMed] [Google Scholar]
Associated Data
This section collects any data citations, data availability statements, or supplementary materials included in this article.
Supplementary Materials
Figure S1. In situ hybridization studies show ZEB1 expression predominantly occur in neurogenic active regions (subventricular zone, cerebellum) and particular strong in prenatal mouse development [©2012 Allen Institute for Brain Science. Late stage parental mouse brain does not show any ZEB1 staining, Allen Developing Mouse Brain Atlas (Internet). Available from: http://developingmouse.brain‐map.org.] (A); strong ZEB1 activation in very early human embryonic development [up to week 9 after last menstrual period, postconceptional week (PCA)] as assed via micro array expression profiling [©2012 Allen Institute for Brain Science. BrainSpan Atlas of the Developing Human Brain (Internet). Available from: http://brainspan.org/] (B).
Table S1. List of antibodies incl. dilutions and primers for qPCR used in this study.
Table S2. Cell line identification profiles of the used in vitro material assessed with short tandem repeat (STR) assay (fetal neural stem cells = fNCS).