


Figure 4.
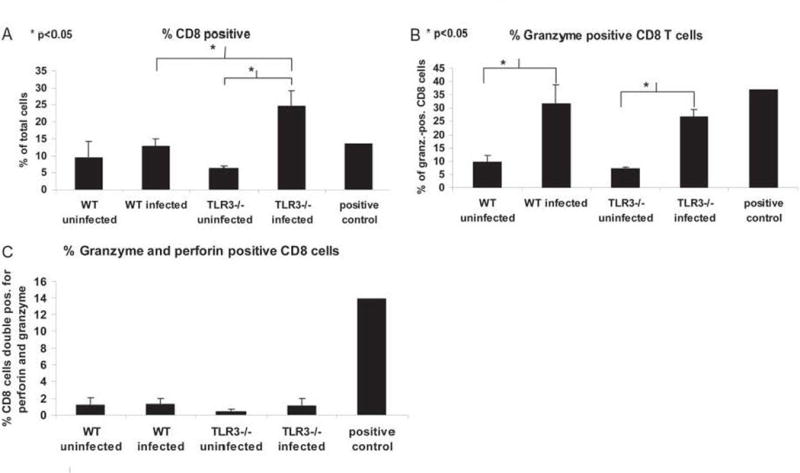
TLR3−/− and WT mice produce similar quantities of activated CTLs in response to vaccinia infection. Mice (n = 3/genotype) were infected i.n. with 1×10⁴ PFU Vac-FL, and CD8 T cells in the lung were analyzed by flow cytometry 7 days postinfection. A, CD8+ cells, expressed as a percent of total cells. B, Granzyme-positive cells, expressed as a percent of CD8+ cells. C, Granzyme and perforin double-positive cells, expressed as a percent of CD8+ cells. Error bars denote SEM. *, Significant differences between genotypes (p < 0.05). Positive control, Splenocytes stimulated in vitro for 4 days with IL-2.