


Figure 2.
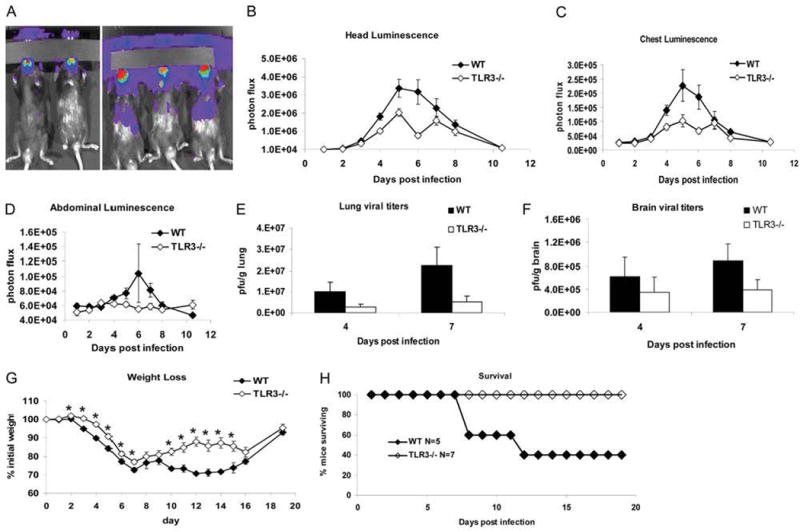
A. TLR3−/− mice are resistant to vaccinia at a dose that is approximately the LD50 for WT. Representative bioluminescence images of TLR3−/− (left) and WT (right) mice on day 4 postinfection. Mice were infected i.n. with 1×10⁴ PFU luminescent reporter vaccinia virus (n = 10 WT and n = 11 TLR3−/−). Photon flux is depicted on a pseudocolor scale with red representing the highest and blue the lowest values.
B–D. TLR3−/− mice are resistant to vaccinia at a dose that is approximately the LD50 for WT. Quantitative bioluminescence imaging data for head (B), chest (C), and abdomen (D) regions of interest. Mice were infected i.n. with 1×10⁴ PFU luminescent reporter vaccinia virus (n = 10 WT and n = 11 TLR3−/−). WT are indicated by filled symbols, and TLR3−/− are denoted with open symbols. Whole body bioluminescence imaging was performed each day postinfection, and photon flux in defined regions of interest was quantified by Living Image software. Data are expressed as mean values for photon flux ± SEM.
E–H. TLR3−/− mice are resistant to vaccinia at a dose that is approximately the LD50 for WT. Plaque assays and illness. Mice were infected i.n. with 1×10⁴ PFU luminescent reporter vaccinia virus (n = 10 WT and n = 11 TLR3−/−). WT are indicated by filled symbols, and TLR3−/− are denoted with open symbols. E, Lung viral titers in WT (filled bars) and TLR3−/− (open bars) on day 4 or 7 postinfection (n = 7 WT and n = 6 TLR3−/−). Plaque data are combined results of two experiments. F, Brain viral titers in WT (filled bars) and TLR3−/− (open bars) on day 4 or 7 postinfection (n = 7 WT day 4 and n = 6 TLR3−/− and WT day 7). G, Weight loss. Data are expressed as mean percent of initial weight (n mean percent weight loss = 10 WT or 11 TLR3−/− on day 1, decreasing to n = 2 WT and n = 7 TLR3−/− on day 13). *, Significant differences between genotypes (p < 0.05). H, Survival curve. A subset of mice (n = 5 WT and n = 7 TLR3−/−) were monitored throughout the experiment until they recovered or were euthanized for 30% weight loss. Five WT and four TLR3−/− mice were euthanized at an intermediate time points.