


Figure 6. BR and Auxin Regulate Gene Expression in a Developmental Zone-Specific Manner.
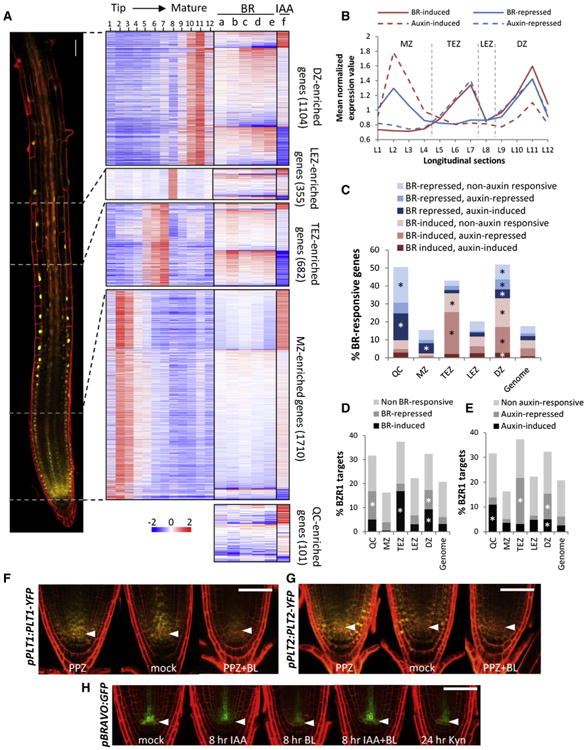
(A–E) BR and auxin responses of genes specifically enriched in the QC, meristem zone (MZ), transition-elongation zone (TEZ), late elongation zone (LEZ), and differentiation zone (DZ) based on the RootMap gene expression dataset [41].
(A) Heatmaps show log2 fold change values of genes specifically enriched in QC and different developmental zones from indicated BR and auxin RNA-seq experiments: Col + BL versus Col (a), dwf4 + BL versus dwf4 (b), Col versus dwf4 (c), Col versus bri1-116 (d), bri1-116/bzr1-1D versus bri1-116 (e), and Col + IAA versus Col (f). Mean-normalized expression values (log2 transformed) of zone-enriched genes from 12 sections along the root longitudinal axis [41] are shown in the same row order with their corresponding BR-auxin expression values. pBZR1:BZR1-YFP root tip divided into four developmental zones is shown on the left.
(B) Average mean-normalized expression values of developmental zone-enriched, BR- and auxin-responsive genes in 12 longitudinal sections (L1–L12).
(C–E) Percentage distribution of BR-responsive genes and their auxin response (C) and of BZR1 target genes and their BR response (D) or auxin response (E) in QC and different developmental zones, compared to the whole genome. Asterisk (*) indicates significant overrepresentation (hypergeometric p value < 0.0001).
(F–H) Expression of pPLT1:PLT1-YFP (F) and pPLT2:PLT2-YFP (G) in roots grown on mock or 2 μM PPZ medium for 6 days and transferred to 2 μM PPZ medium with or without 100 nM BL for 24 hr.
(H) Expression of pBRAVO:GFP after treatments of 5 μM IAA, 100 nM BL, or both for 8 hr, or 25 μM Kynurenine for 24 hr.
Arrowheads indicate QC cell layer. Scale bars represent 50 μm. See also Table S2.