


Figure 5.
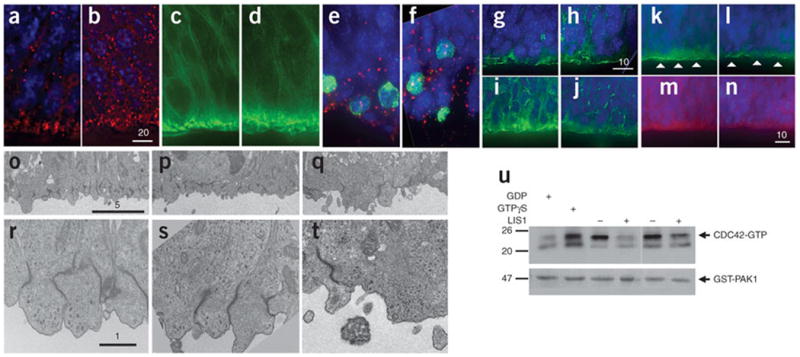
LIS1-overexpressing mice show reduced cell polarity in the ventricular zone. (a,b) Immunostaining for β-catenin (red) in E14.5 brain sections from control (a) and LIS1-overexpressing (b) mice. Nuclei were labeled with DAPI (blue). Scale bar size is given in micrometers. (c,d) Staining for phalloidin-FITC (green) in E14.5 brain sections from control (c) and LIS1-overexpressing (d) mice. Fewer dense patches were observed in d compared to c. (e,f) Immunostaining for pericentrin (red) and phosphorylated histone H3 (green) in E14.5 brain sections of control (e) and LIS1-overexpressing (f) mice. Nuclei were labeled with DAPI. Wider distribution of centrosomes was observed in f. (g,h) Immunostaining for Numb (green) in E14.5 brain sections from control (g) and LIS1-overexpressing (h) mice. Wider cytoplasmic distribution of Numb was observed in h. (i,j) Immunostaining for pan-cadherin (green) in E14.5 brain sections from control (i) and LIS1-overexpressing (j) mice. Lower cadherin expression was observed in the apical surface of j. (k–n) Immuno-fluorescence for aPKCλ (green), PAR6 (red) and nuclei (blue) in control (k,m) and LIS1-overexpressing (l,n) E14.5 brain sections. Arrowheads in k and l highlight discontinuity in aPKC immunostaining. PAR6 staining was markedly lower in n versus m. (o–t) Electron micrographs of E12.5 brain sections at two magnifications. (o,r) Control in which transgene was inserted without Cre. (p,s) Additional Cre control. (q,t) LIS1 overexpression. Disorganization and reduction in adherens junctions were observed at lower (q) and higher magnification (t) in LIS1-overexpressing brains. (u) Cdc42 activity, measured by pulling down GTP-bound form of Cdc42. Addition of GTPγS served as positive control; GDP served as negative control. Less Cdc42-GTP was detected in E15.5 LIS1-overexpressing brain lysates compared to control.