


Figure 2.
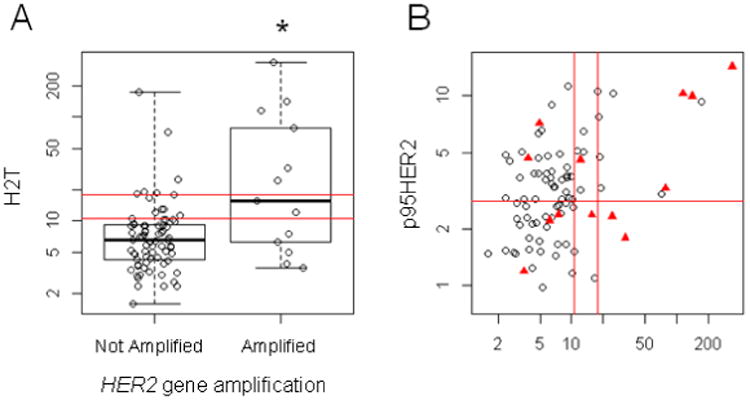
Box plots and scatterplots demonstrating relationship between HER2 gene amplification, total HER2 and p95HER2 protein expression. The double red lines delineate the HERmark negative, equivocal and positive zones which align with centrally determined HER2 status in BrCa as described in Methods. Panel A demonstrates that HER2 gene amplification was associated with a significantly higher H2T score (p < 0.002). Panel B displays the H2T and p95HER2 values, with the red triangles representing the HER2 gene amplified samples. The red line at p95HER2 = 2.8 RF/mm2 is the cutoff value associated with trastuzumab resistance in BrCa. HER2 gene amplification was not associated with p95HER2 values.