


Fig. 3.
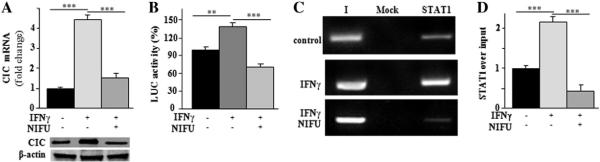
Molecular mechanism of IFNγ-triggered SLC25A1 upregulation. (A) CIC mRNA (upper panel) and protein (lower panel) levels from U937/PMA untreated (−) or treated (+) with IFNγ and incubated with (+) or without (−) nifuroxazide. Real-time PCR values represent mean ± s.e.m. (N = 6). Western blot data are representative of three independent experiments with similar results. (B) U937/PMA cells transfected with the pGL3 basic-LUC vector containing the −1785/−20 bp region of the CIC gene promoter and incubated with (+) or without (−) nifuroxazide were treated with IFNγ and assayed for luciferase activity. Luciferase values represent mean ± s.e.m. (N = 5). (C) ChIP analysis was done with anti-STAT1 in IFNγ-treated U937/PMA cells incubated as above. Lane Mock, PCR of immunoprecipitates without antibody; lane I, PCR of input DNA.(D) qPCR-ChIP was quantified by real-time PCR. Data are expressed as fold change versus control. qPCR values represent mean ± s.e.m. (N = 3).