


FIGURE 4.
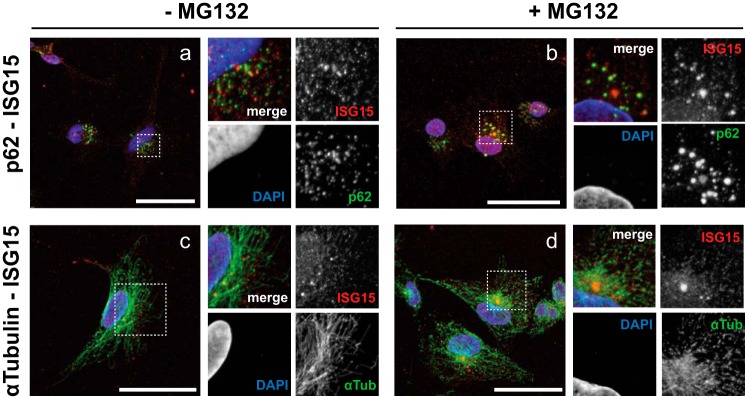
ISG15 and p62 co-localization in insoluble fraction. a–d, U251 cells were treated with IFNβ (1,000 units/ml; 16 h) before treatment with MG132 (40 μm; 5 h) (b and d) or without it (a and c). Prepermeabilized cells were fixed with 4% paraformaldehyde and subjected to fluorescence microscopy analysis using Alexa Fluor 488 (green) against p62 and α-tubulin, Alexa Fluor 555 (red) against ISG15, and DAPI (blue). High magnification rescans of the broken line box regions of interest are shown in the panels on the right of each sample image. Scale bars, 50 μm.