


FIGURE 2.
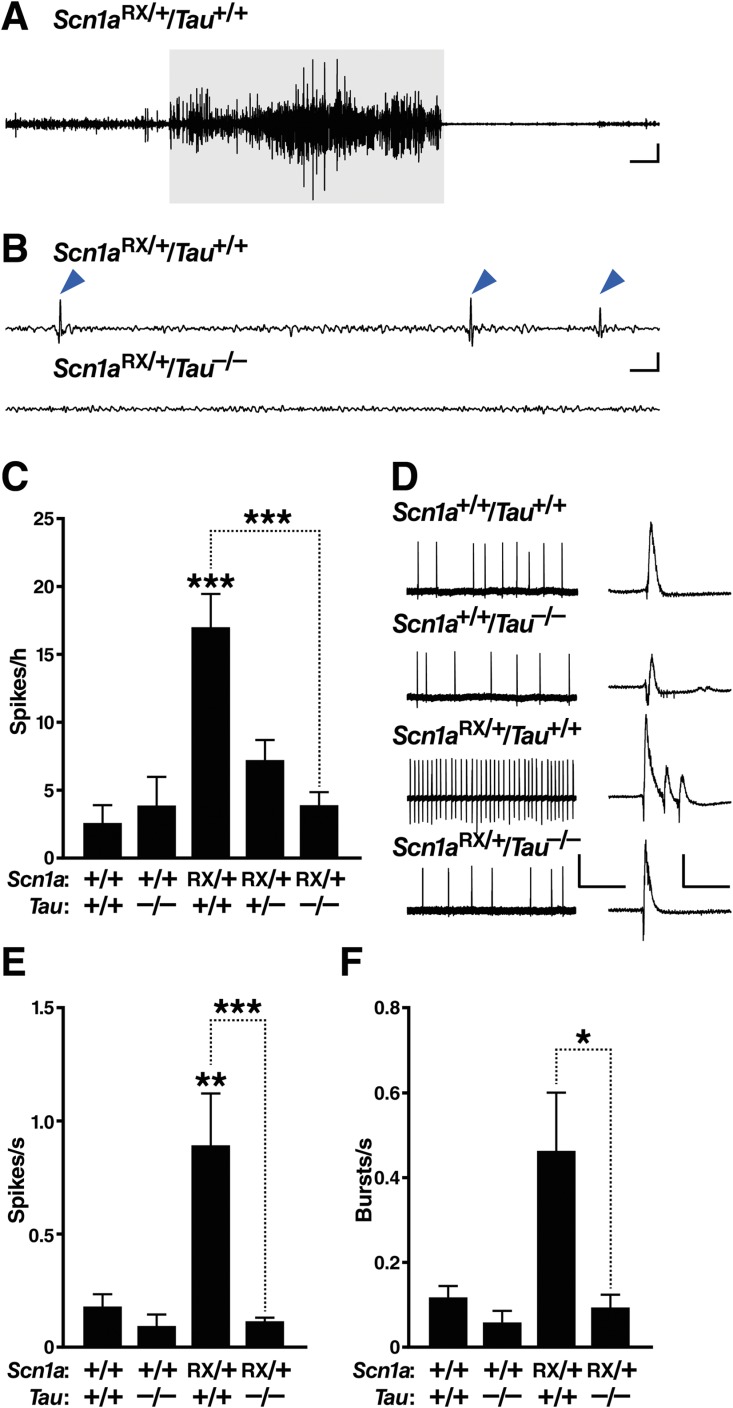
Tau ablation reduces epileptic activity in Scn1aRX/+ mice. (A–C) Subdural electroencephalographic (EEG) recordings were obtained in freely behaving mice of the indicated genotypes at 2 to 3 months of age. For the traces in (A) and (B), the low and high frequency filters were set at 5Hz and 40Hz, respectively. (A) Representative EEG trace depicting a seizure in an Scn1aRX/+ mouse. This seizure (highlighted in gray) lasted 30 seconds and had a severity score of 4 (see Materials and Methods). Scale bars = 3 sec (horizontal), 0.25V (vertical). (B) Representative traces of interictal EEG activity. Note the spikes (arrowheads) in Scn1aRX/+/Tau+/+ mice. Scale bars = 0.3 sec (horizontal), 0.5V (vertical). (C) Quantitation of epileptic spikes during 1 hour of a 24-hour recording session (n = 6–24 mice per genotype). Linear regression: p = 0.0030, F1,58 = 11.08 for an interaction between Scn1a and Tau genotypes. Gene–dose effect of Tau deletion in Scn1aRX/+ mice: p = 0.0000054 (Wald test). Exploratory post hoc 1-tailed t tests without multiple comparison correction indicated that Scn1aRX/+/Tau+/− mice differed from both Scn1aRX/+/Tau+/+ (p = 0.0085) and Scn1a+/+/Tau+/+ mice (p = 0.0087). ***p < 0.00001 versus Scn1a+/+/Tau+/+ mice or as indicated by bracket (Tukey–Kramer test). (D–F) Epileptiform activity in acute hippocampal slices from mice of the indicated genotypes was elicited by superfusion with picrotoxin (50μM) and 4-aminopyridine (200μM) for 30 minutes. (D) Representative field recordings of epileptic activity. Higher resolution traces are shown on the right, depicting individual spikes and a burst of multiple spikes recorded in the Scn1aRX/+ slice. Scale bars in main traces: 20 seconds (horizontal), 0.5mV (vertical); insets: 250 milliseconds (horizontal), 1.0mV (vertical). (E) Quantification of spike frequency. (F) Quantification of burst frequency (n = 3–6 mice per genotype and 17–27 slices per mouse). *p < 0.05, **p < 0.01, ***p < 0.001 versus Scn1a+/+/Tau+/+ slices or as indicated by bracket (linear mixed effects model). Values represent mean ± standard error of the mean. [Color figure can be viewed in the online issue, which is available at http://www.annalsofneurology.org.]