


Figure 1. Experimental setup of kinase inhibitor screen.
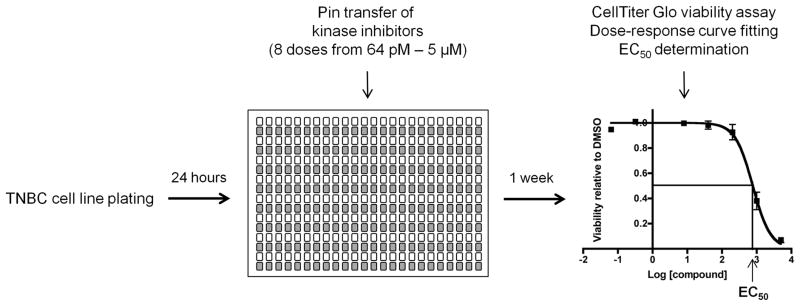
TNBC and control cells were plated in 384-well plates, and 24 hours later, kinase inhibitors were added via pin transfer. Cells were incubated in the presence of inhibitors for one week, after which cell viability was assessed. Duplicate screening data were normalized to DMSO-treated controls, and dose-response curves were fitted using GraphPad Prism version 6.0. EC50 values were generated and represent cell line responses to the kinase inhibitors.