


FIGURE 2.
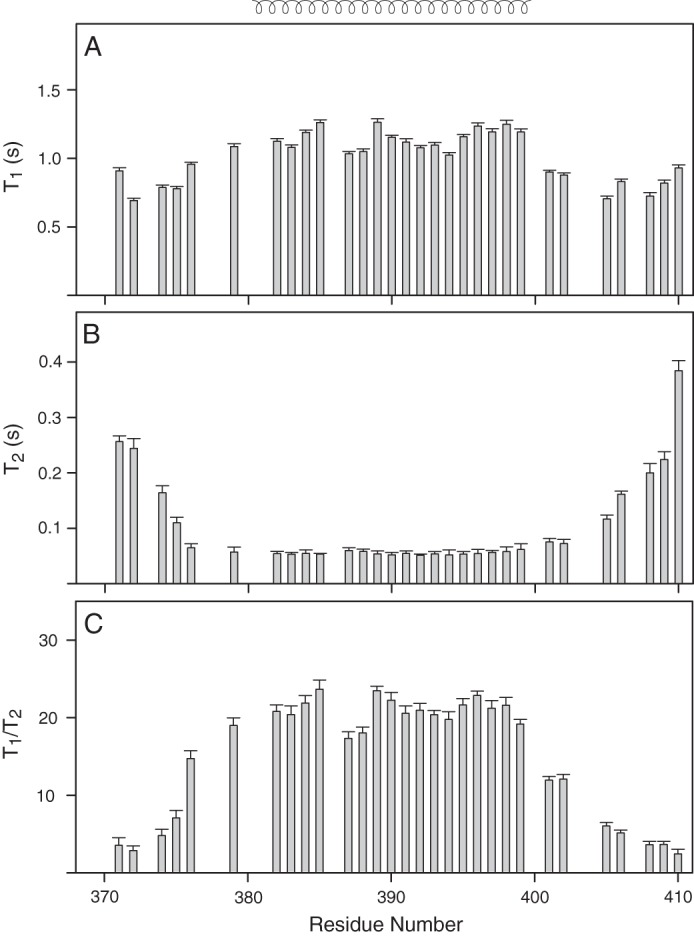
Backbone 15N relaxation dynamics of TM domain of human LAMP-2A in DPC micelles. The 15N T1 (A) and T2 (B) relaxation data of TM-LAMP-2A and their ratio (C) are plotted as a function of residue number. Relaxation values could not be estimated for residues Asp373, Ala380, Val381, Ala386, Leu400, and Tyr407 due to spectral overlap and weak intensity resulting in improper fit. The residues Ser369, Ala370, Val377, Pro378, His403, and His404 are not assigned. The mean value of T1 and T2 for the structured region is 1153.5 ± 20.1 and 55.1 ± 2.9 ms, respectively, corresponding to an estimated rotational correlation time (τc) of 14.4 ns. The secondary structural elements are shown at the top of A. Error bars represent fitting errors in the relaxation times.