


FIG 2.
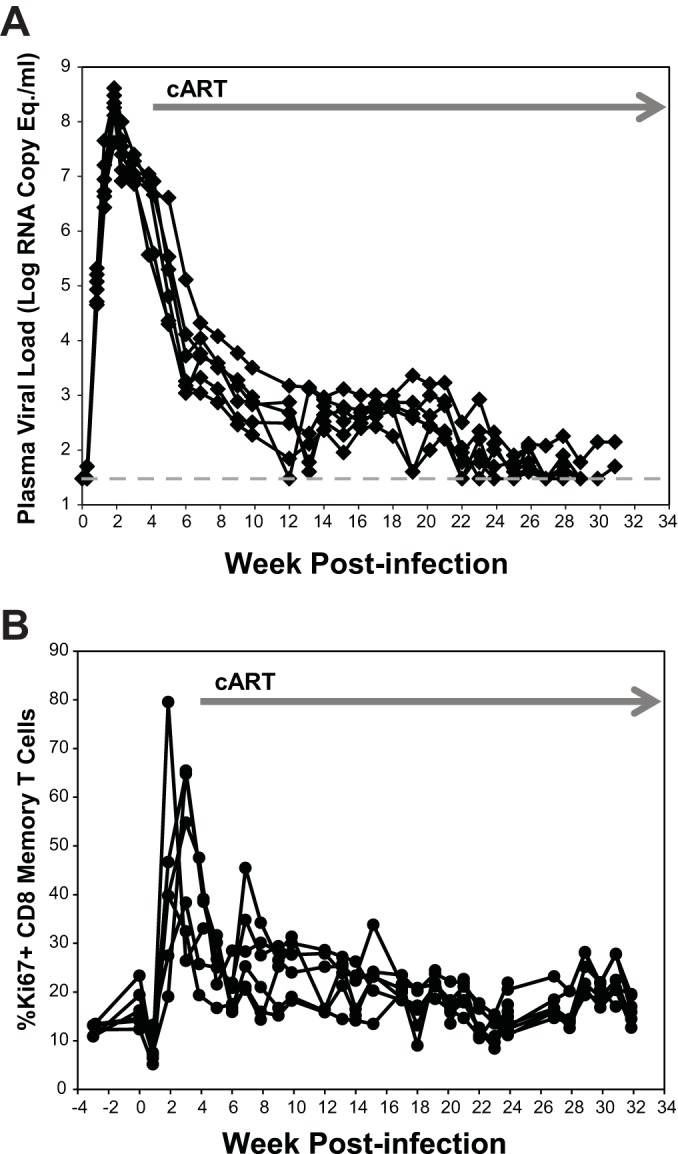
Virologic and immunologic responses to cART. (A) Plasma viral loads in six animals treated with cART starting at 4 weeks postinfection (gray arrow), determined via a qRT-PCR assay with a 30-copy/ml quantification limit (dashed gray line). Data for two of the six animals shown have been reported previously (35). (B) Longitudinal analysis of the percent CD8+ memory T cells that are Ki67+ with cART treatment (gray arrow) for the same six animals shown in panel A. Data shown in both panels A and B are for the pre-SAHA treatment phase of the study.