


Extended Data Figure 1. Autophagosome enrichment protocol validation.
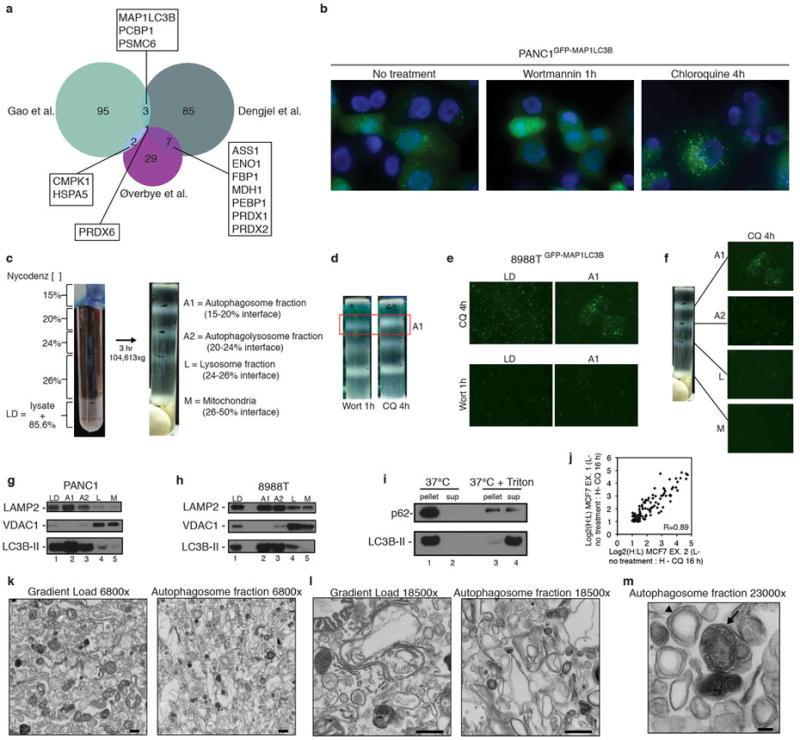
a, Overlap of proteins identified in three prior autophagosome proteomics studies11-13 as evaluated by area-proportional Venn diagram. Proteins overlapping between datasets are noted. b, PANC1 cells stably expressing GFP-MAP1LC3B have a high level of basal autophagy (left panel). 1h Wortmannin (200 nM) treatment blocks autophagosome formation (middle panel) and 4h chloroquine treatment (25 μM) causes accumulation of autophagosomes (right panel). c, Lysed 8988T cells mixed with Nycodenz and placed at the bottom of a discontinuous density gradient with Nycodenz layers at the indicated concentrations (left). After 3h centrifugation at indicated speed, 4 bands appear at the indicated interfaces with enrichment of the indicated organelles in each interface (right). d, 8988T cells treated with either Wortmannin (1h, 200 nM) or Chloroquine (4h, 25 μM) subjected to gradient centrifugation. A decreased amount of material is recovered from the A1 (autophagosome) interface due to the effect of Wortmannin on autophagosome formation. e, Fluorescence microscopy of gradient load (LD) and autophagosome fraction (A1) from 8988T cells stably expressing GFP-MAP1LC3B after either chloroquine or wortmannin treatment. f, Fluorescence microscopy of indicated fractions from density gradient of 8988T cells stably expressing GFP-MAP1LC3B treated with chloroquine (A1 fraction image is also presented in panel e and gradient picture is also presented in panel c). g, PANC1 autophagosome fractions analyzed by immunoblotting using antibodies to LAMP2, VDAC1, and LC3B. LD is gradient load, A1 is autophagosome fraction from 15-20% nycodenz interface, A2 is the autophagolysosome fraction from the 20-24% nycodenz interface, L is the lysosome fraction from the 24-26% nycodenz interface, M is the mitochondrial fraction from the 26%-50% nycodenz interface. h, 8988T autophagosome fractions analyzed as in g. i, 8988T autophagosomes (A1 fraction) were incubated at 37°C for 1 hour -/+ Triton X-100 and centrifuged at high speed. The resulting pellet was resuspended in equal volume to supernatant and assayed by immunoblotting with antibodies to p62 and LC3B. j, Pearson correlation plot for overlapping candidates from MCF7 experiments (102 proteins, comparing Ex. 1 vs. Ex. 2). k, Electron micrographs of 8988T gradient load (LD, left panel) and 8988T autophagosome fraction (A1, right panel) at 6800× magnification, scale bar 500 nm. l, 8988T gradient load (LD, left panel) and 8988T autophagosome fraction (A1, right panel) at 18500× magnification, scale bar 500 nm. m, 8988T autophagosome fraction (A1) at 23000× magnification, scale bar 100 nm. Arrowhead: double-membrane autophagosome, Arrow: fused autophagolysosome.