


Fig. 5.
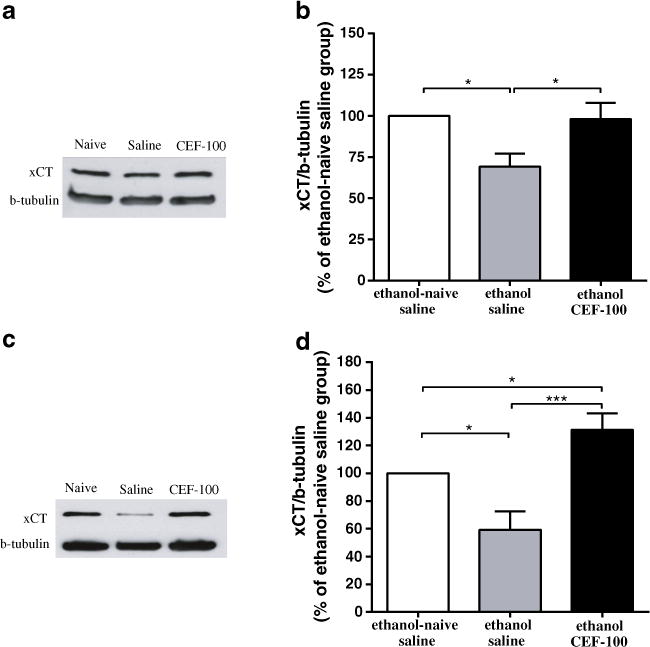
Effects of ceftriaxone (CEF) on xCT expression in the PFC and NAc in continuous ethanol-drinking paradigm. a Immunoblots for xCT expression in the PFC and β-tubulin as a control-loading protein. b There was significant difference in xCT level in the PFC between ethanol-naïve saline and ethanol saline groups. CEF treatment significantly increased xCT level in the PFC as compared to ethanol saline group. c Immunoblots for xCT expression in the NAc and β-tubulin as a control-loading protein. d There was significant difference in the xCT level in the NAc between ethanol-naïve saline and ethanol saline groups. CEF treatment significantly increased the xCT level in the NAc as compared to ethanol-naïve saline and ethanol saline groups. Data are expressed as mean ± SEM. (*p<0.05, ***p<0.001); (N=5–6)