


Figure 4. Large-Scale Network Membership of IQ CWAS.
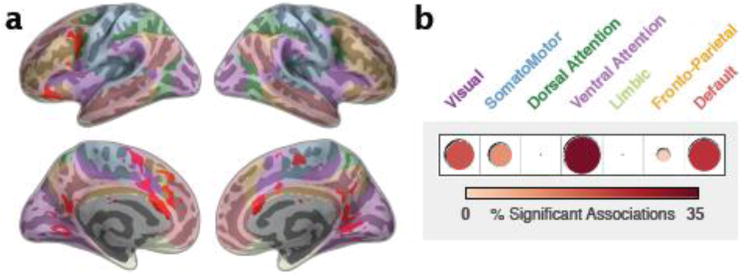
(a) Overlap of significant associations related to IQ between two scans (same as Fig 3b) is shown in red and overlaid on seven functional networks of interest presented by Yeo et al. (2011). The networks are displayed as semi-transparent and correspond to the colored labels given in (b). (b) The proportion of significant associations related to IQ in each of the seven networks is depicted graphically.