


Figure 4.
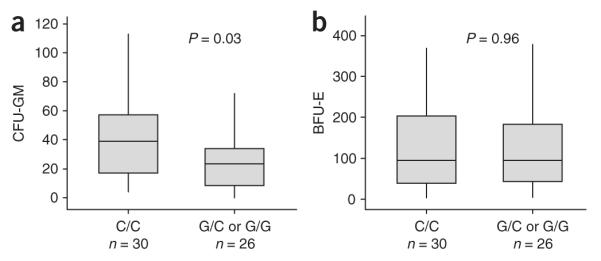
Association between JAK2 haplotype and numbers of hemopoietic colonies. CFU-GM and BFU-E colony growth per 4 × 10⁵ peripheral blood mononuclear cells from 56 healthy controls that were 46/1 nullizygous (C/C at rs12340895, n = 30) or had at least one 46/1 allele (G/C, n = 21; or G/G, n = 5). Box plots illustrate the 95% range (vertical lines), median (horizontal lines) and interquartile range (boxes). Colony numbers were compared by the Mann-Whitney U test.