


Figure 2. Individual age at symptom onset vs measures of family onset history.
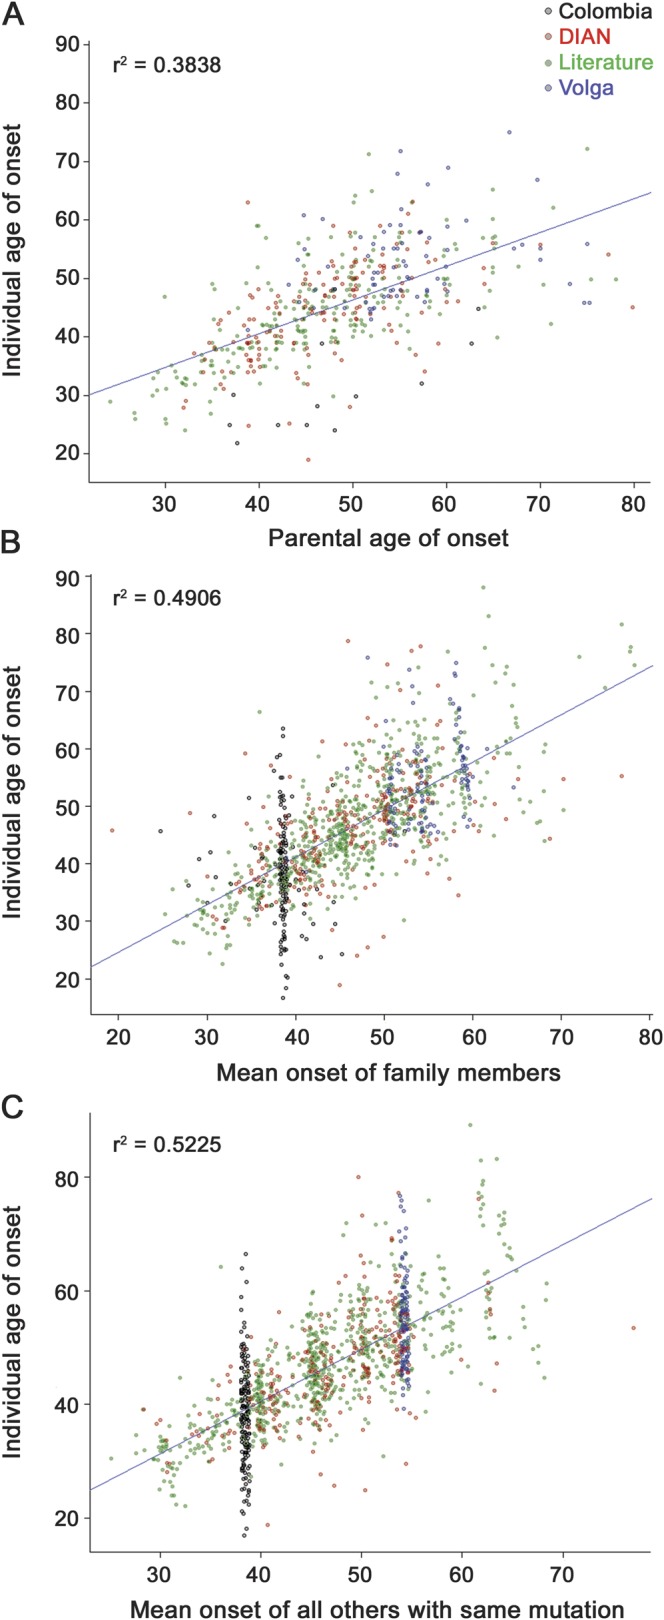
The actual age at symptom onset for each affected individual is shown on the y-axis, plotted against values predicted from family history on the x-axis. (A) Each individual's age at onset vs the reported age at onset of their affected parent. (B) Each individual's age at onset vs the mean age at onset for all other individuals in their extended family. (C) Each individual's age at onset vs the mean age at onset for all other individuals sharing the same autosomal dominant Alzheimer disease mutation type. Plot points for each individual are colored according to their study of origin, as shown in the legend at the upper right. Jitter was added to the x- and y-axes for easier visualization. Regression lines and adjusted r2 values showing correlations between individual age at onset and each of these family history measures are displayed on the respective figures. DIAN = Dominantly Inherited Alzheimer Network.