


Figure 2. Characterization of Human Ago2 Brain Cluster Sequences.
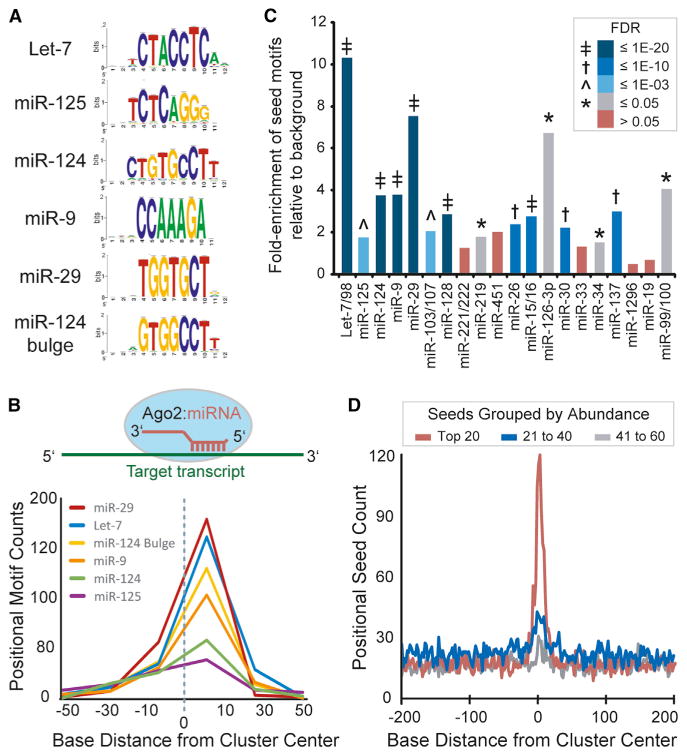
(A) Analysis of cluster sequences with RSAT (peak motifs tool) identified significant enrichment of motifs corresponding to abundant brain miRNAs (logos shown).
(B) Graph summarizing the positional enrichment of motifs identified by RSAT run on Ago2 brain cluster sequences. The enriched motifs corresponding to abundant brain miRNAs are located to the right of center, which is consistent with miRNA target recognition via reverse complementary Watson-Crick base pairing, as illustrated above.
(C) The relative combined enrichment of 7A1 and 7m8 sites corresponding to the top 20 most abundant miRNA seeds is shown. The significance of enrichment (Ago2 clusters versus background; FDR) is indicated by color key and symbol.
(D) The positional seed counts within and near Ago2 brain clusters (centered on zero, median cluster size is 51 nt) are shown for the indicated miRNA seeds grouped by abundance rank.
See also Figures S3 and S4 and Tables S4 and S5.