


Figure 1.
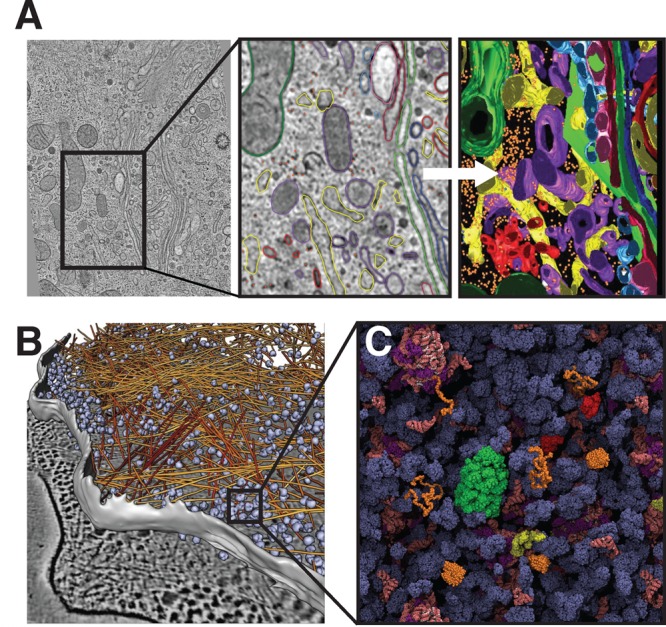
Intracellular complexity. (A) Left: Cryo-electron tomography slice of a mammalian cell. Middle: Close-up view of cellular structures colored according to their identities: Right: Three-dimensional surface representation of the same region. Yellow, endoplasmic reticulum; orange, free ribosomes; green, mitochondria; blue, dense core vesicles; red, clathrin-positive compartments and vesicles; purple, clathrin-negative compartments and vesicles. Reprinted with permission from ref (27). Copyright 2012 Public Library of Science. (B) Tomography image of the interior of a Dictyostelium cell with actin filaments shown in orange and ribosomes in blue. Reprinted with permission from ref (29). Copyright 2012 Rockefeller University Press. (C) Schematic representation of the E. coli cytosol. Ribosomes and tRNA are shown in pink, chaperones in green and red, disordered proteins in orange, and all other proteins in dark blue. Reprinted with permission from ref (28). Copyrigth 2011 Elsevier.