


Figure 2.
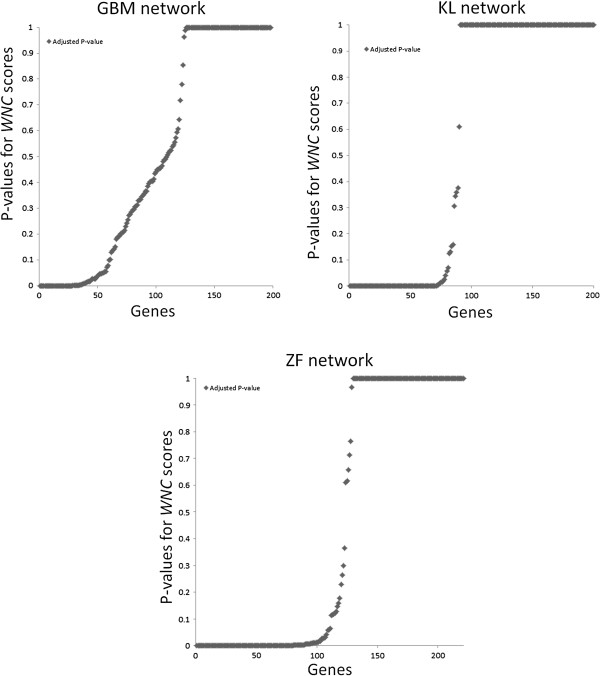
Identification of statistically significant genes based on WNC scores. For each network, the adjusted P values computed for all the WNC scores is displayed. Genes with low P values represent potential biologically relevant genes and can be used for further analysis.