


Extended Data Figure 5. In-vitro characterization of amph-CpG.
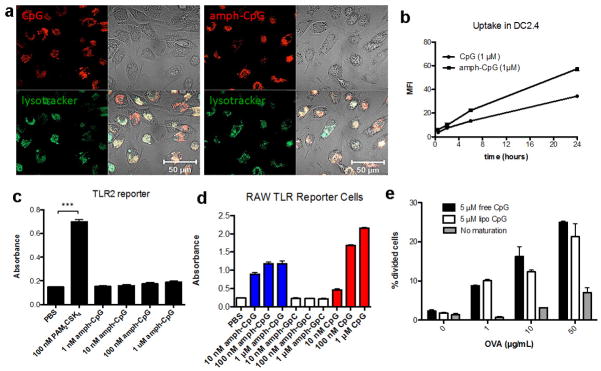
a, Rhodamine labeled CpG or amph-CpG (1 μM) was incubated with murine bone marrow-derived dendritic cells (BMDCs) at 37°C for 4 hours with LysoTracker® (Life Technologies) and imaged using a Zeiss LSM 510 confocal microscope (Oberkochen, Germany). b, Rhodamine labeled CpG or amph-CpG (1 μM) was incubated for 30 minutes, 2 hours, 6 hours, and 24 hours with the murine dendritic cell line DC2.4. Cells were stained with DAPI and uptake was quantified by flow cytometry using the mean fluorescence intensity (MFI) of viable (DAPI-) cells. c, Amph-CpG or PAM2CSK4 (a strong TLR2 agonist) was incubated for 24 hours with the InvivoGen HEK-Blue™ murine TLR2 reporter cell line, a secreted embryonic alkaline phosphatase (SEAP) reporter system. SEAP levels were quantified by incubating supernatant with QuantiBlue™ substrate for 1h and reading absorption at 620 nm. d, Amph-CpG, CpG, or control amph-GpC (1 μM) were incubated with InvivoGen RAW-Blue™ mouse macrophage reporter cells, which secrete SEAP upon TLR, NOD or Dectin-1 stimulation. SEAP levels were quantified by incubating supernatant with QuantiBlue™ substrate for 1h and reading absorption at 620 nm. e, Bone marrow-derived immature dendritic cells were incubated overnight with indicated concentrations of OVA and maturation stimuli (or medium alone). DCs were washed 3 times with PBS and 30,000 CFSE-labeled OT-I CD8+ T cells were then added to each well. Cells were collected after 2 days of co-culture, and stained and gated for DAPI- (viable) CD8+ T cells using Flowjo v.7.6.5 (Treestar). Extent of proliferation was quantified by determining the % of cells that had undergone division by determining % of viable CD8+ T cells that had diluted CFSE using T cells alone as a control for the no division/dilution peak. Shown are mean±s.e.m. in b–d; ***, p < 0.001 by one-way ANOVA with Bonferroni post-test. Bars in e represent medians and whiskers represent range (n=2 wells/condition).