


Figure 1.
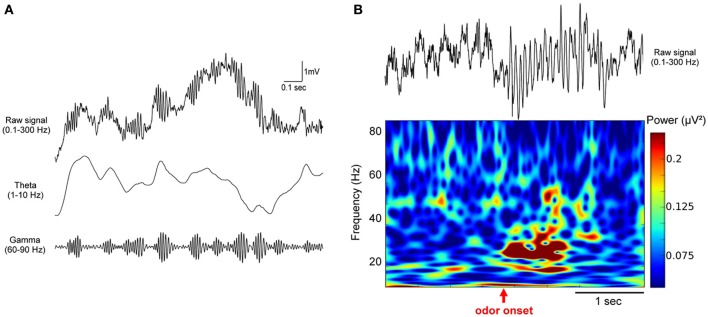
Odor stimulation modifies beta (15–35 Hz) and gamma (60–90 Hz) oscillations in the olfactory bulb. Example of LFP traces recorded in the olfactory bulb in freely moving mice. (A) Raw LFP signal (0.1–300 Hz) on first row is filtered in the theta (1–10 Hz) and the gamma (60–90 Hz) bands, showing the close relation between gamma bursts and the respiratory modulation. (B) Raw LFP signal (0.1–300 Hz) and corresponding time-frequency power representation in a mouse conditioned in a Go/No-Go task. Time-frequency plot was obtained based on Morlet wavelet analysis. It represents the power of the signal (as indicated by the color scale) as a function of time (x-axis) for each frequency (y-axis). Odorant onset is indicated by the vertical red arrow. Note that odor elicits an overall decrease in the gamma band and an increase in the beta band power.