


Figure 4. In vivo two photon imaging of GCaMP2.2c and GCaMP3 expressing neocortical neurons.
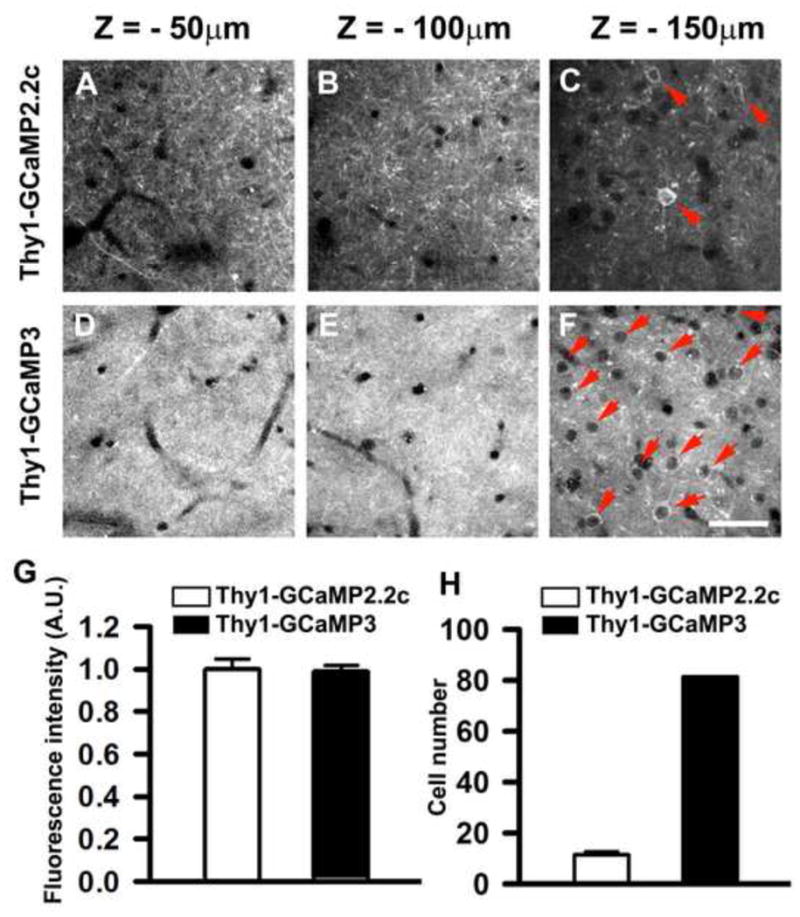
In vivo two-photon images of GCaMP-expressing neurons in the motor cortex of 5-month-old Thy1-GCaMP2.2c (A–C) and Thy1- GCaMP3 (D–F) mice. The depth below the pial surface is shown above each panel. In Thy1-GCaMP2.2c mice, densely packed yet resolvable individual dendrites were clearly visible in the superficial layers (A and B), whereas the density of labeled dendrites was much higher in Thy1-GCaMP3 animals (D and E). Thy1-GCaMP2.2c mice had few layer II/III neurons labeled (C), whereas GCaMP3 was expressed in almost all layer II/III neurons (F). Red arrows mark individual Layer II/III neurons. See also Movie S4 and S5. (G) Quantification of brightness of neuronal somata from Thy1-GCaMP2.2c and Thy1-GCaMP3 transgenic mice 150–160 μm below the pial surface, n = 75 from 3 mice). (H) Quantification of neuron number in 250 × 250 μm area from Thy1-GCaMP2.2c and Thy1-GCaMP3 transgenic mice 150–160 μm below the pial surface, n = 10 from 3 mice). Data are presented as mean ± SEM. Scale bar, 50 μm.