


Fig. 2.
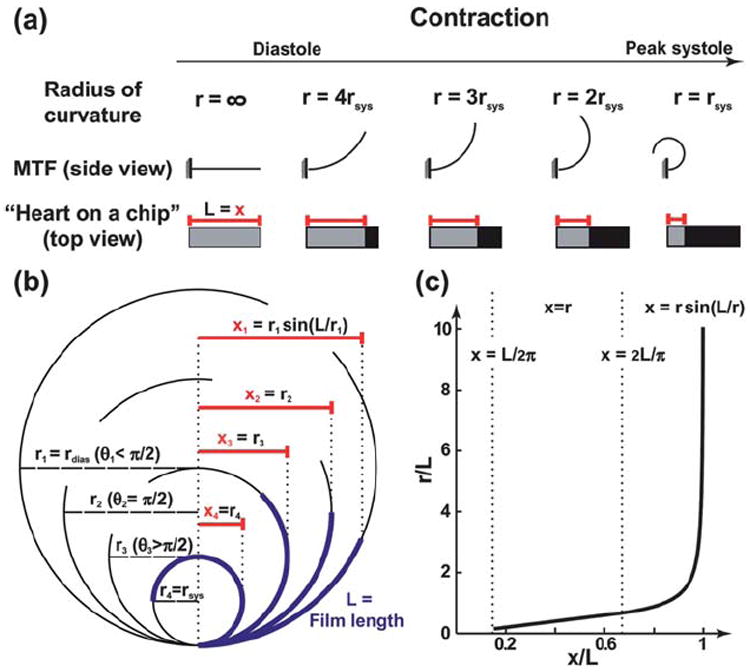
Calculation of the radius of curvature. (a) A schematic drawing contrasting the view of the regular MTF assay with the “heart on a chip”, through the contraction cycle; (b) The x-projection measured during the running of the assay, as the radius of curvature increases; (c) Plot showing the relationship between the measured x-projection and the radius of curvature, with appropriate equations to use in each region.