


Figure 7. Social interaction time differences between P and NP rat lines.
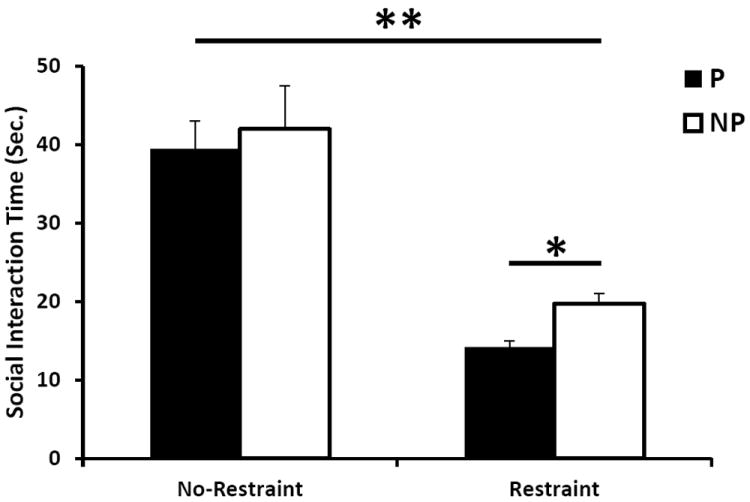
The social interaction test was performed on the selectively bred P and NP rats before and after 30 minute restraint stress. The SI time (seconds) is the total amount of interaction time (sniffing, grooming, etc.) initiated between the P or NP rat and a Wistar rat. Asterisk denotes significant differences between P and NP rats and between restraint and no restraint (*p<0.05, ** p<0.0001).