


Figure 4. IR-laser mediated conditioned gustatory suppression.
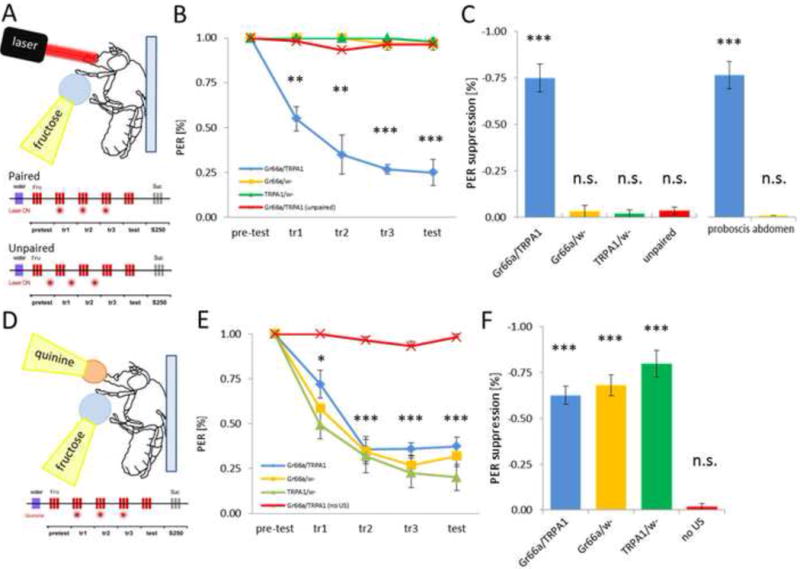
A) For optogenetic conditioning, a fly is mounted on a glass slide and stimulated with 10mM fructose applied to tarsi. The IR-laser is focused on the proboscis area and is active for 0.5s. For paired conditioning, laser stimulation is delivered together with fructose stimulation on tarsi. For unpaired conditioning, laser stimulation precedes the onset of fructose stimulation. B) PER of Gr66a/dTRPA1 flies and control flies in response to 10mM fructose was scored before, during and after stimulation with the IR-laser (laser power set to 1.72V). Both groups showed 100% PER in pre-test, but only flies expressing dTRPA1 significantly reduced PER response already after the first training session (p < 0.005) and showed even higher reduction in the test (p < 0.001). Fl ea s with matching genotypes but with laser stimulation preceding fructose presentation (unpaired group) did not change PER response compared to pretest levels. Flies carrying GAL4 or UAS alone and having fructose presentation paired with laser stimulation also did not reduce PER following training. C) Quantification of PER suppression during testing reveals that only flies expressing dTRPPA1 in Gr66a-neurons suppressed PER response when in the paired group (p < 0.001). Unpairing of the IR-laser with fructose did not lead to PER suppression in the same flies. Also targeting the laser beam on abdomen (as opposed to proboscis) did not reduce PER response to fructose. D) Gr66a/dTRPA1 flies and controls were conditioned for quinine-mediated suppression of PER. E) Time course of fructose-elicited tarsal PER response during and after simultaneous application of quinine on proboscis. PER response to fructose was significantly reduced after the initial training session for all genotypes tested (p < 0.05). Flies presented with fructose alone did not show PER suppression during training or test. F) Quantification of PER response during test phase. All genotypes achieved significant PER suppression when paired with quinine (p < 0.05). P-values are displayed as * p < 0.05, ** p < 0005, *** p < 0.001.