


Figure 2.
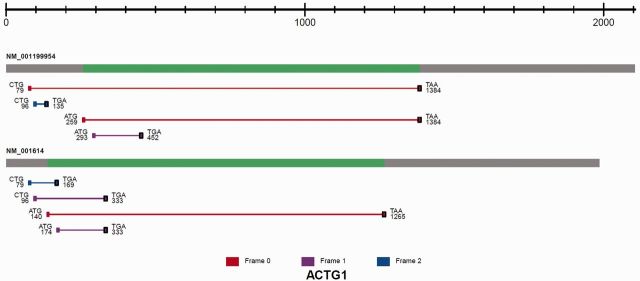
The image of predicted ORFs associated with the identified TIS sites is shown for ACTG1. All isoforms of the transcript are displayed. From left to right, the transcript structure consists of the 5′ UTR (grey), CDS (green) and 3′ UTR (grey). Each ORF is represented as a line between an identified TIS and a predicted stop codon (black square). The ORF is color coded according to reading frames (red, frame 0; purple, frame 1; blue, frame 2). The TIS codon sequence composition is shown together with the coordinates relative to the transcription start site.